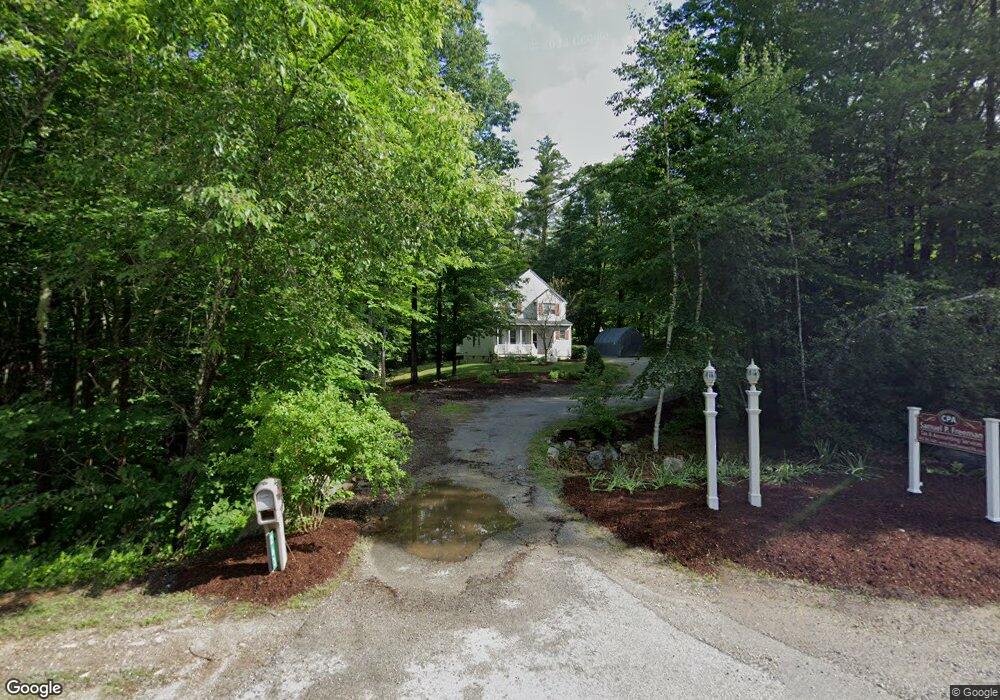
263 New Boston Rd Bedford, NH 03110
Bedford NeighborhoodEstimated Value: $637,000 - $697,000
3
Beds
3
Baths
1,901
Sq Ft
$349/Sq Ft
Est. Value
About This Home
This home is located at 263 New Boston Rd, Bedford, NH 03110 and is currently estimated at $662,589, approximately $348 per square foot. 263 New Boston Rd is a home located in Hillsborough County with nearby schools including Mckelvie Intermediate School, Ross A. Lurgio Middle School, and Bedford High School.
Ownership History
Date
Name
Owned For
Owner Type
Purchase Details
Closed on
Feb 4, 2015
Sold by
Muffaletto Peter J
Bought by
Freeman Samuel P
Current Estimated Value
Home Financials for this Owner
Home Financials are based on the most recent Mortgage that was taken out on this home.
Original Mortgage
$245,471
Outstanding Balance
$184,409
Interest Rate
3.25%
Mortgage Type
FHA
Estimated Equity
$478,180
Purchase Details
Closed on
Oct 26, 2004
Sold by
Freeman Edward and Freeman Andrea R
Bought by
Muffaletto Peter J
Create a Home Valuation Report for This Property
The Home Valuation Report is an in-depth analysis detailing your home's value as well as a comparison with similar homes in the area
Home Values in the Area
Average Home Value in this Area
Purchase History
| Date | Buyer | Sale Price | Title Company |
|---|---|---|---|
| Freeman Samuel P | $250,000 | -- | |
| Muffaletto Peter J | $211,000 | -- |
Source: Public Records
Mortgage History
| Date | Status | Borrower | Loan Amount |
|---|---|---|---|
| Open | Freeman Samuel P | $245,471 | |
| Previous Owner | Muffaletto Peter J | $249,900 |
Source: Public Records
Tax History Compared to Growth
Tax History
| Year | Tax Paid | Tax Assessment Tax Assessment Total Assessment is a certain percentage of the fair market value that is determined by local assessors to be the total taxable value of land and additions on the property. | Land | Improvement |
|---|---|---|---|---|
| 2024 | $8,996 | $569,000 | $243,500 | $325,500 |
| 2023 | $8,421 | $569,000 | $243,500 | $325,500 |
| 2022 | $7,684 | $436,600 | $180,400 | $256,200 |
| 2021 | $7,483 | $436,600 | $180,400 | $256,200 |
| 2020 | $7,281 | $363,700 | $131,600 | $232,100 |
| 2019 | $6,892 | $363,700 | $131,600 | $232,100 |
| 2018 | $6,861 | $336,300 | $131,600 | $204,700 |
| 2017 | $6,562 | $347,000 | $131,600 | $215,400 |
| 2016 | $11,554 | $310,500 | $105,000 | $205,500 |
| 2015 | $6,805 | $299,000 | $105,000 | $194,000 |
| 2014 | $6,692 | $297,400 | $105,000 | $192,400 |
| 2013 | $6,593 | $297,400 | $105,000 | $192,400 |
Source: Public Records
Map
Nearby Homes
- 53 Essex Rd
- 9 Cherry Ln
- 27 Birkdale Rd Unit LOTS 170/171
- 28 Olde Lantern Rd
- 99 Cambridge Rd
- 74 Settlers Ct
- 39 Mcintosh Ln
- 12 Mcintosh Ln
- Lot 6 Aisling Ln Unit Lot 6 - The Silverto
- 32 Wellesley Dr
- 60 Riddle Dr
- 44-9 Olympus Way
- 4 Westview Rd Unit Lot 4 - Hannah Floor
- 250 Joppa Hill Rd
- 3 Westview Rd Unit Lot 3 - The Saffron
- 40 Tirrell Hill Rd
- 3 Baldwin Ln
- 18 Grand Ave Unit Lot 7
- 15 Grand Ave Unit Lot 3
- 17 Grand Ave
- 259 New Boston Rd
- 43 Marston Dr
- 45 Marston Dr
- 59 Essex Rd
- 55 Essex Rd
- 63 Essex Rd
- 275 New Boston Rd
- 44 Marston Dr
- 148 Powder Hill Rd
- 41 Marston Dr
- 42 Marston Dr
- 142 Powder Hill Rd
- 281 New Boston Rd
- 56 Essex Rd
- 36 Marston Dr
- 60 Essex Rd
- 49 Essex Rd
- 11 Chesterfield Place
- 140 Powder Hill Rd
- 12 Chesterfield Place