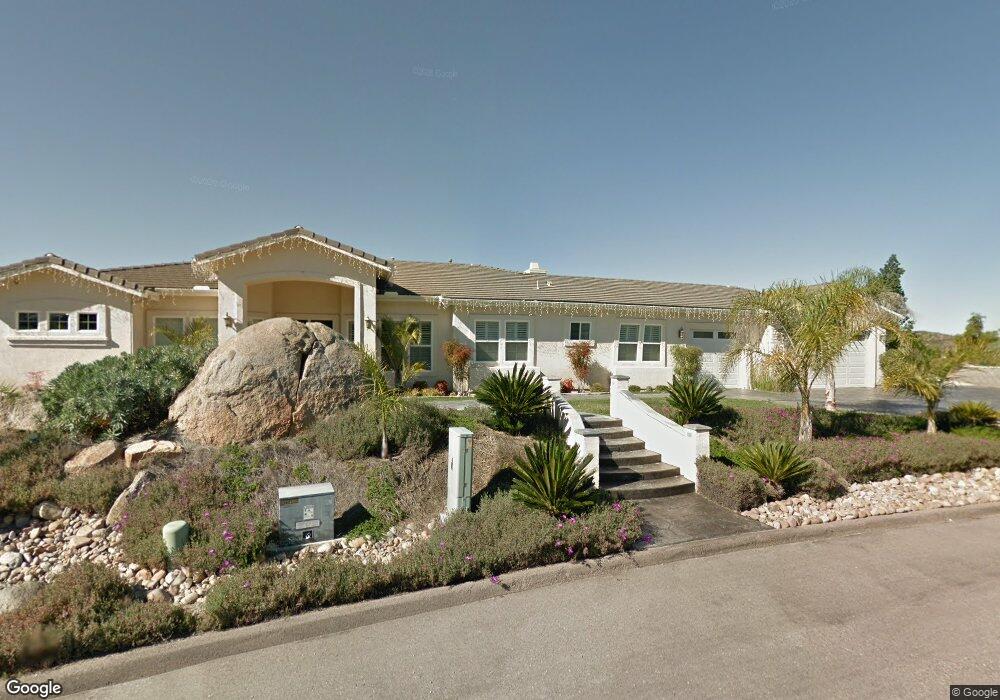
263 Old Stagecoach Run Alpine, CA 91901
Estimated Value: $1,223,000 - $1,356,000
4
Beds
3
Baths
2,826
Sq Ft
$455/Sq Ft
Est. Value
About This Home
This home is located at 263 Old Stagecoach Run, Alpine, CA 91901 and is currently estimated at $1,286,108, approximately $455 per square foot. 263 Old Stagecoach Run is a home located in San Diego County with nearby schools including Granite Hills High School, The Heights Charter, and Liberty Charter High School.
Ownership History
Date
Name
Owned For
Owner Type
Purchase Details
Closed on
Oct 27, 2021
Sold by
Upp Jeffrey Michael and Winslow Upp Andrea
Bought by
Winslow Upp Andrea and Upp Jeffrey Michael
Current Estimated Value
Purchase Details
Closed on
Oct 31, 2014
Sold by
Sightler James Keith and Singhtler Zahaira A
Bought by
Upp Jeffrey Michael and Winslow Upp Andrea
Home Financials for this Owner
Home Financials are based on the most recent Mortgage that was taken out on this home.
Original Mortgage
$546,250
Outstanding Balance
$419,984
Interest Rate
4.1%
Mortgage Type
New Conventional
Estimated Equity
$866,124
Purchase Details
Closed on
Jul 23, 2004
Sold by
Rei Nc/Dartmouth Ii Llc
Bought by
Sightler James Keith and Sightler Zahaira A
Home Financials for this Owner
Home Financials are based on the most recent Mortgage that was taken out on this home.
Original Mortgage
$615,000
Interest Rate
1.5%
Mortgage Type
Unknown
Create a Home Valuation Report for This Property
The Home Valuation Report is an in-depth analysis detailing your home's value as well as a comparison with similar homes in the area
Home Values in the Area
Average Home Value in this Area
Purchase History
| Date | Buyer | Sale Price | Title Company |
|---|---|---|---|
| Winslow Upp Andrea | -- | None Available | |
| Upp Jeffrey Michael | $685,000 | Ticor Title | |
| Sightler James Keith | $769,000 | First American Title |
Source: Public Records
Mortgage History
| Date | Status | Borrower | Loan Amount |
|---|---|---|---|
| Open | Upp Jeffrey Michael | $546,250 | |
| Previous Owner | Sightler James Keith | $615,000 |
Source: Public Records
Tax History
| Year | Tax Paid | Tax Assessment Tax Assessment Total Assessment is a certain percentage of the fair market value that is determined by local assessors to be the total taxable value of land and additions on the property. | Land | Improvement |
|---|---|---|---|---|
| 2025 | $10,048 | $899,857 | $273,198 | $626,659 |
| 2024 | $10,048 | $882,214 | $267,842 | $614,372 |
| 2023 | $10,225 | $864,917 | $262,591 | $602,326 |
| 2022 | $10,152 | $847,959 | $257,443 | $590,516 |
| 2021 | $10,443 | $831,334 | $252,396 | $578,938 |
| 2020 | $9,943 | $822,810 | $249,808 | $573,002 |
| 2019 | $9,756 | $806,677 | $244,910 | $561,767 |
| 2018 | $9,547 | $790,860 | $240,108 | $550,752 |
| 2017 | $8,604 | $709,353 | $235,400 | $473,953 |
| 2016 | $8,262 | $695,445 | $230,785 | $464,660 |
| 2015 | $8,214 | $685,000 | $227,319 | $457,681 |
| 2014 | $8,056 | $675,000 | $224,000 | $451,000 |
Source: Public Records
Map
Nearby Homes
- 2406 Mcdougal Place
- 1478 Peutz Valley Rd
- 2638 W Victoria Dr
- 720 Sky Mountain Ln
- 0 England Place
- 2501 Columbine Dr
- 2346 Larkspur Dr
- 2389 Victoria Cir
- 2855 N Victoria Dr
- 3006 N Victoria Dr
- 1960 Boulders Ln
- 2288 Boulders Ct
- 2274 Boulders Ct
- 2400 Alpine Blvd Unit 148
- 2400 Alpine Blvd Unit 68
- 2400 Alpine Blvd Unit 135
- 2400 Alpine Blvd Unit 136
- 2400 Alpine Blvd Unit 47
- 0 Peutz Way Unit 250039332
- 1434 Marshall Rd Unit 20
- 245 Old Stagecoach Run
- 2086 Martingale Ln
- 331 Old Stagecoach Run
- 227 Old Stagecoach Run
- 2073 Martingale Ln
- 2070 Martingale Ln
- 345 Old Stagecoach Run
- 209 Old Stagecoach Run
- 352 Old Stagecoach Run
- 2054 Martingale Ln
- 210 Old Stagecoach Run
- 2038 Martingale Ln
- 2380 Bonnett Ln
- 2007 Martingale Ln
- 2022 Martingale Ln
- 228 Old Stagecoach Run
- 2389 Bonnett Ln
- 2230 Running Mare Ln
- 2006 Martingale Ln
- 2377 Bonnett Ln
Your Personal Tour Guide
Ask me questions while you tour the home.