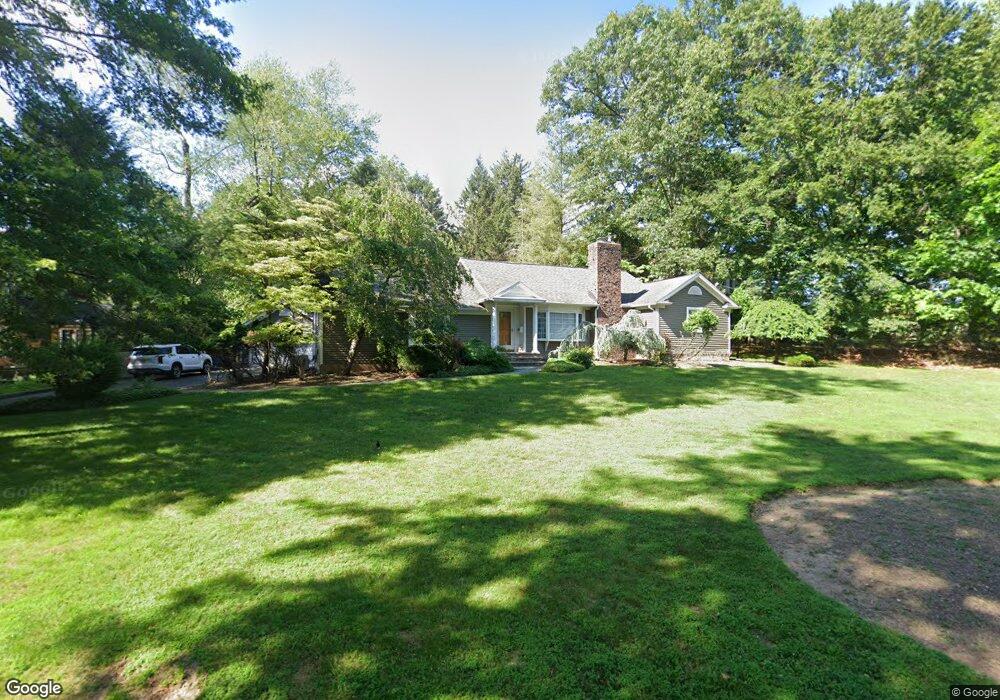
263 Parkway Harrington Park, NJ 07640
Estimated Value: $1,082,443 - $1,339,000
--
Bed
--
Bath
2,941
Sq Ft
$400/Sq Ft
Est. Value
About This Home
This home is located at 263 Parkway, Harrington Park, NJ 07640 and is currently estimated at $1,176,611, approximately $400 per square foot. 263 Parkway is a home located in Bergen County with nearby schools including Harrington Park Elementary School and Northern Valley Regional High School at Old Tappan.
Ownership History
Date
Name
Owned For
Owner Type
Purchase Details
Closed on
Jul 24, 2012
Sold by
Hwang John M and Hwang Minseoung S
Bought by
Lee Chester C and Lee Sophia H
Current Estimated Value
Home Financials for this Owner
Home Financials are based on the most recent Mortgage that was taken out on this home.
Original Mortgage
$450,000
Outstanding Balance
$311,069
Interest Rate
3.7%
Mortgage Type
New Conventional
Estimated Equity
$865,542
Purchase Details
Closed on
Jan 14, 1998
Sold by
Cheevers Philip Charles and Cheevers Mary Elizabeth
Bought by
Hwang John M and Hwnag Minseoung S
Create a Home Valuation Report for This Property
The Home Valuation Report is an in-depth analysis detailing your home's value as well as a comparison with similar homes in the area
Home Values in the Area
Average Home Value in this Area
Purchase History
| Date | Buyer | Sale Price | Title Company |
|---|---|---|---|
| Lee Chester C | $1,123 | -- | |
| Hwang John M | $343,000 | -- |
Source: Public Records
Mortgage History
| Date | Status | Borrower | Loan Amount |
|---|---|---|---|
| Open | Lee Chester C | $450,000 |
Source: Public Records
Tax History Compared to Growth
Tax History
| Year | Tax Paid | Tax Assessment Tax Assessment Total Assessment is a certain percentage of the fair market value that is determined by local assessors to be the total taxable value of land and additions on the property. | Land | Improvement |
|---|---|---|---|---|
| 2025 | $20,476 | $654,800 | $288,800 | $366,000 |
| 2024 | $19,847 | $654,800 | $288,800 | $366,000 |
| 2023 | $19,520 | $654,800 | $288,800 | $366,000 |
| 2022 | $19,520 | $654,800 | $288,800 | $366,000 |
| 2021 | $19,382 | $654,800 | $288,800 | $366,000 |
| 2020 | $19,297 | $654,800 | $288,800 | $366,000 |
| 2019 | $18,891 | $654,800 | $288,800 | $366,000 |
| 2018 | $18,544 | $654,800 | $288,800 | $366,000 |
| 2017 | $18,348 | $654,800 | $288,800 | $366,000 |
| 2016 | $17,824 | $654,800 | $288,800 | $366,000 |
| 2015 | $17,378 | $654,800 | $288,800 | $366,000 |
| 2014 | $16,979 | $654,800 | $288,800 | $366,000 |
Source: Public Records
Map
Nearby Homes