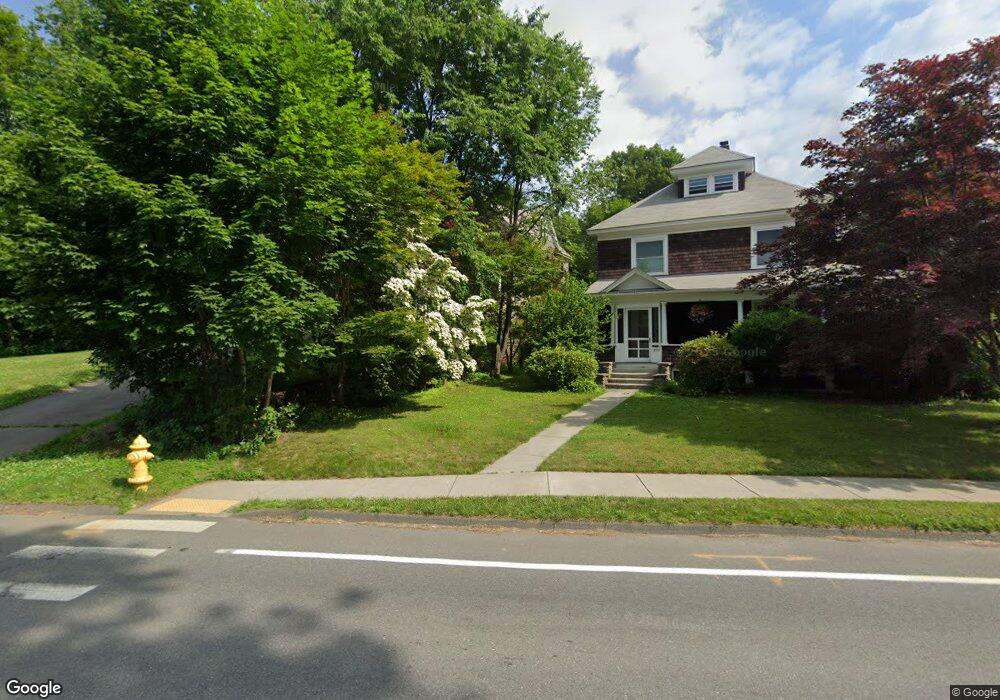
263 Silver St Unit 265 Greenfield, MA 01301
Estimated Value: $256,000 - $379,000
5
Beds
2
Baths
2,918
Sq Ft
$106/Sq Ft
Est. Value
About This Home
This home is located at 263 Silver St Unit 265, Greenfield, MA 01301 and is currently estimated at $309,678, approximately $106 per square foot. 263 Silver St Unit 265 is a home located in Franklin County with nearby schools including Cornerstone Christian School, Holy Trinity School, and Stoneleigh-Burnham School.
Ownership History
Date
Name
Owned For
Owner Type
Purchase Details
Closed on
Jul 29, 2022
Sold by
Crowningshield Stephen H and Crowningshield Kim L
Bought by
Bobisfat Llc
Current Estimated Value
Purchase Details
Closed on
May 31, 2022
Sold by
Crowningshield D V Est
Bought by
Crowningshield Stephen H and Crowningshield Kim L
Purchase Details
Closed on
Jul 13, 2009
Sold by
Crowningshield Richard L
Bought by
Crowningshield Dolores V
Create a Home Valuation Report for This Property
The Home Valuation Report is an in-depth analysis detailing your home's value as well as a comparison with similar homes in the area
Home Values in the Area
Average Home Value in this Area
Purchase History
| Date | Buyer | Sale Price | Title Company |
|---|---|---|---|
| Bobisfat Llc | $202,000 | None Available | |
| Crowningshield Stephen H | -- | None Available | |
| Crowningshield Stephen H | -- | None Available | |
| Crowningshield Dolores V | -- | -- | |
| Crowningshield Dolores V | -- | -- |
Source: Public Records
Tax History Compared to Growth
Tax History
| Year | Tax Paid | Tax Assessment Tax Assessment Total Assessment is a certain percentage of the fair market value that is determined by local assessors to be the total taxable value of land and additions on the property. | Land | Improvement |
|---|---|---|---|---|
| 2025 | $4,689 | $239,700 | $74,400 | $165,300 |
| 2024 | $4,592 | $225,200 | $61,200 | $164,000 |
| 2023 | $4,533 | $230,700 | $61,200 | $169,500 |
| 2022 | $3,484 | $156,100 | $58,300 | $97,800 |
| 2021 | $3,383 | $145,700 | $58,300 | $87,400 |
| 2020 | $3,341 | $145,700 | $58,300 | $87,400 |
| 2019 | $3,088 | $138,100 | $50,700 | $87,400 |
| 2018 | $3,026 | $134,900 | $49,600 | $85,300 |
| 2017 | $2,931 | $134,900 | $49,600 | $85,300 |
| 2016 | $3,093 | $141,800 | $52,500 | $89,300 |
| 2015 | $3,086 | $137,100 | $52,500 | $84,600 |
| 2014 | $2,815 | $137,100 | $52,500 | $84,600 |
Source: Public Records
Map
Nearby Homes