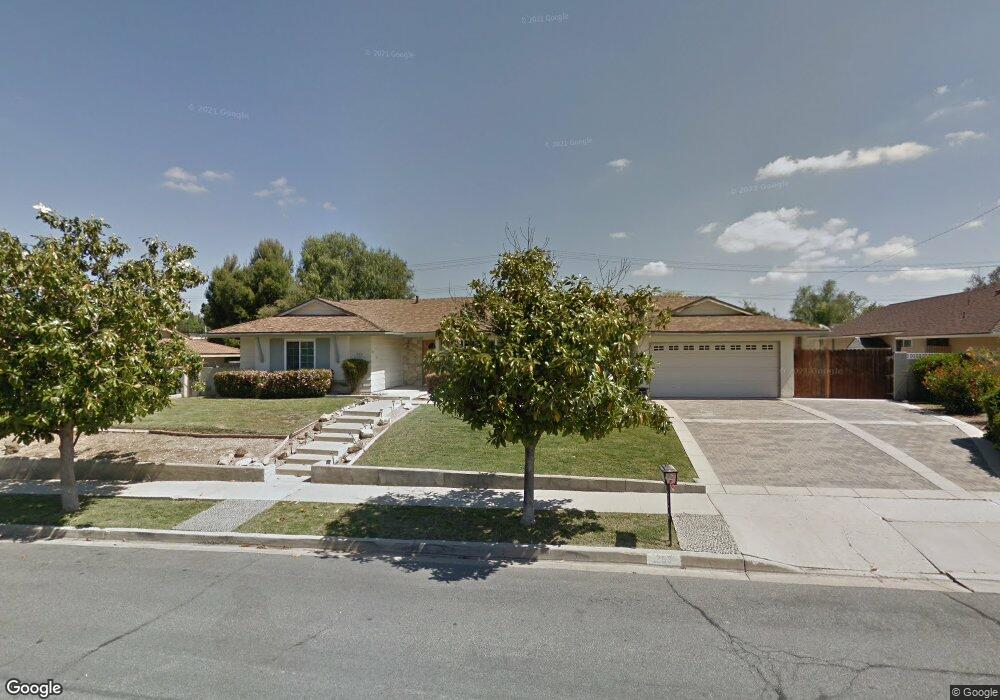
263 Somerset Cir Thousand Oaks, CA 91360
Estimated Value: $1,000,000 - $1,380,000
6
Beds
3
Baths
2,383
Sq Ft
$477/Sq Ft
Est. Value
About This Home
This home is located at 263 Somerset Cir, Thousand Oaks, CA 91360 and is currently estimated at $1,136,774, approximately $477 per square foot. 263 Somerset Cir is a home located in Ventura County with nearby schools including Acacia Elementary School, Redwood Middle School, and Thousand Oaks High School.
Ownership History
Date
Name
Owned For
Owner Type
Purchase Details
Closed on
Nov 23, 2016
Sold by
Herschel Mark
Bought by
Herschel Elizabeth
Current Estimated Value
Home Financials for this Owner
Home Financials are based on the most recent Mortgage that was taken out on this home.
Original Mortgage
$540,000
Outstanding Balance
$434,888
Interest Rate
3.52%
Mortgage Type
New Conventional
Estimated Equity
$701,886
Purchase Details
Closed on
Oct 4, 2016
Sold by
Barnett James and Herschel Elizabeth
Bought by
Herschel Elizabeth and Barnett James
Home Financials for this Owner
Home Financials are based on the most recent Mortgage that was taken out on this home.
Original Mortgage
$540,000
Outstanding Balance
$434,888
Interest Rate
3.52%
Mortgage Type
New Conventional
Estimated Equity
$701,886
Purchase Details
Closed on
Nov 19, 2014
Sold by
Barnett Eunice C
Bought by
Barnett Eunice C
Create a Home Valuation Report for This Property
The Home Valuation Report is an in-depth analysis detailing your home's value as well as a comparison with similar homes in the area
Home Values in the Area
Average Home Value in this Area
Purchase History
| Date | Buyer | Sale Price | Title Company |
|---|---|---|---|
| Herschel Elizabeth | -- | Ticor Title | |
| Herschel Elizabeth | -- | None Available | |
| Barnett Eunice C | -- | None Available |
Source: Public Records
Mortgage History
| Date | Status | Borrower | Loan Amount |
|---|---|---|---|
| Open | Herschel Elizabeth | $540,000 |
Source: Public Records
Tax History Compared to Growth
Tax History
| Year | Tax Paid | Tax Assessment Tax Assessment Total Assessment is a certain percentage of the fair market value that is determined by local assessors to be the total taxable value of land and additions on the property. | Land | Improvement |
|---|---|---|---|---|
| 2025 | $1,768 | $126,166 | $24,479 | $101,687 |
| 2024 | $1,768 | $123,693 | $23,999 | $99,694 |
| 2023 | $1,692 | $121,268 | $23,528 | $97,740 |
| 2022 | $1,671 | $118,891 | $23,067 | $95,824 |
| 2021 | $1,697 | $116,560 | $22,614 | $93,946 |
| 2020 | $1,320 | $115,367 | $22,383 | $92,984 |
| 2019 | $1,286 | $113,106 | $21,945 | $91,161 |
| 2018 | $1,261 | $110,889 | $21,515 | $89,374 |
| 2017 | $1,237 | $108,716 | $21,094 | $87,622 |
| 2016 | $1,152 | $106,585 | $20,681 | $85,904 |
| 2015 | $1,131 | $104,985 | $20,371 | $84,614 |
| 2014 | $1,114 | $102,930 | $19,973 | $82,957 |
Source: Public Records
Map
Nearby Homes
- 240 W Gainsborough Rd
- 385 Somerset Cir
- 1461 Dover Ave
- 37 Wales St
- 224 Oakleaf Dr Unit 105
- 224 Oakleaf Dr Unit 102
- 255 Sequoia Ct Unit 21
- 327 Chestnut Hill Ct Unit 22
- 360 Massey St
- 111 Donnick Ave
- 291 Sequoia Ct Unit 13
- 324 Chestnut Hill Ct Unit 14
- 1449 Fordham Ave
- 1509 Campbell Ave
- 1202 Monte Sereno Dr
- 1229 Monte Sereno Dr
- 788 Pinetree Cir Unit 13
- 8 W Janss Rd
- 1543 Norwich Ave
- 910 Warwick Ave
- 277 Somerset Cir
- 249 Somerset Cir
- 194 W Gainsborough Rd
- 188 W Gainsborough Rd
- 274 Somerset Cir
- 182 W Gainsborough Rd
- 204 W Gainsborough Rd
- 235 Somerset Cir
- 258 Somerset Cir
- 1252 Greenfield St
- 212 W Gainsborough Rd
- 242 Somerset Cir
- 176 W Gainsborough Rd
- 1230 Greenfield St
- 221 Somerset Cir
- 1208 Greenfield St
- 224 Somerset Cir
- 207 Somerset Cir
- 1305 Feather Ave Unit B
- 1305 Feather Ave