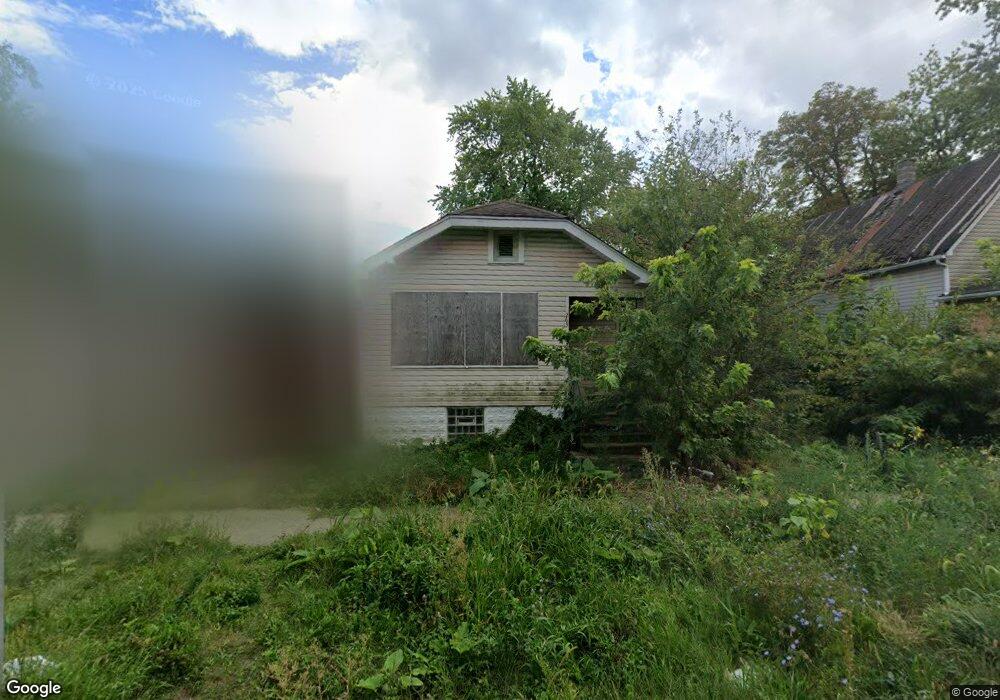
263 W 106th St Chicago, IL 60628
Roseland NeighborhoodEstimated Value: $67,372 - $141,000
2
Beds
1
Bath
764
Sq Ft
$142/Sq Ft
Est. Value
About This Home
This home is located at 263 W 106th St, Chicago, IL 60628 and is currently estimated at $108,593, approximately $142 per square foot. 263 W 106th St is a home located in Cook County with nearby schools including Lavizzo Elementary School and Julian High School.
Ownership History
Date
Name
Owned For
Owner Type
Purchase Details
Closed on
Feb 21, 2013
Sold by
Secretary Of Hud Of Washington Dc
Bought by
Wsh Llc
Current Estimated Value
Purchase Details
Closed on
Sep 6, 2012
Sold by
Swopes Mcgee
Bought by
Secretary Of Hud
Purchase Details
Closed on
Dec 8, 2005
Sold by
Dillon Mcgill
Bought by
Mcgee Lisa
Home Financials for this Owner
Home Financials are based on the most recent Mortgage that was taken out on this home.
Original Mortgage
$19,000
Interest Rate
6.48%
Mortgage Type
Fannie Mae Freddie Mac
Purchase Details
Closed on
Dec 23, 2003
Sold by
Jagoda John and Jagoda Andrew
Bought by
Dillon Mcgill
Home Financials for this Owner
Home Financials are based on the most recent Mortgage that was taken out on this home.
Original Mortgage
$76,000
Interest Rate
5.91%
Mortgage Type
Unknown
Purchase Details
Closed on
Apr 4, 2003
Sold by
Altegra Credit Co
Bought by
Jagoda Andrew and Jagoda John
Create a Home Valuation Report for This Property
The Home Valuation Report is an in-depth analysis detailing your home's value as well as a comparison with similar homes in the area
Home Values in the Area
Average Home Value in this Area
Purchase History
| Date | Buyer | Sale Price | Title Company |
|---|---|---|---|
| Wsh Llc | -- | Chicago Title Insurance Comp | |
| Secretary Of Hud | -- | None Available | |
| Mcgee Lisa | $95,000 | Pntn | |
| Dillon Mcgill | $80,000 | Ticor Title Insurance | |
| Jagoda Andrew | $18,500 | Git | |
| Jagoda Andrew | $18,500 | Git |
Source: Public Records
Mortgage History
| Date | Status | Borrower | Loan Amount |
|---|---|---|---|
| Previous Owner | Mcgee Swopes Lisa | $114,187 | |
| Previous Owner | Mcgee Lisa | $19,000 | |
| Previous Owner | Mcgee Lisa | $76,000 | |
| Previous Owner | Dillon Mcgill | $76,000 | |
| Previous Owner | Coleman Lucielle M | $40,000 |
Source: Public Records
Tax History Compared to Growth
Tax History
| Year | Tax Paid | Tax Assessment Tax Assessment Total Assessment is a certain percentage of the fair market value that is determined by local assessors to be the total taxable value of land and additions on the property. | Land | Improvement |
|---|---|---|---|---|
| 2024 | $39 | $6,400 | $3,847 | $2,553 |
| 2023 | $16 | $3,500 | $1,790 | $1,710 |
| 2022 | $16 | $3,500 | $1,790 | $1,710 |
| 2021 | $34 | $3,498 | $1,788 | $1,710 |
| 2020 | $353 | $4,683 | $3,526 | $1,157 |
| 2019 | $346 | $5,147 | $3,526 | $1,621 |
| 2018 | $339 | $5,147 | $3,526 | $1,621 |
| 2017 | $1,406 | $9,891 | $3,206 | $6,685 |
| 2016 | $1,341 | $9,891 | $3,206 | $6,685 |
| 2015 | $1,197 | $9,891 | $3,206 | $6,685 |
| 2014 | $1,186 | $6,374 | $2,885 | $3,489 |
| 2013 | $1,162 | $6,374 | $2,885 | $3,489 |
Source: Public Records
Map
Nearby Homes
- 314 W 106th Place
- 337 W 106th Place
- 352 W 106th Place
- 325 W 107th St
- 341 W 105th Place
- 355 W 105th Place
- 10617 S Wentworth Ave
- 224 W 105th Place
- 235 W 105th St
- 310 W 105th St
- 10530 S La Salle St
- 323 W 108th St
- 10505 S Eggleston Ave
- 10739 S La Salle St
- 10807 S Wentworth Ave
- 220 W 104th Place
- 10615 S Perry Ave
- 10623 S Perry Ave
- 10514 S Perry Ave
- 10510 S Perry Ave
- 263 W 106th St
- 261 W 106th St
- 301 W 106th St
- 309 W 106th St
- 251 W 106th St
- 313 W 106th St
- 311 W 106th St
- 262 W 106th St
- 264 W 106th St
- 260 W 106th St
- 315 W 106th St
- 256 W 106th St
- 302 W 106th St
- 264 W 106th Place
- 300 W 106th Place
- 258 W 106th Place
- 304 W 106th Place
- 254 W 106th St
- 317 W 106th St
- 254 W 106th Place