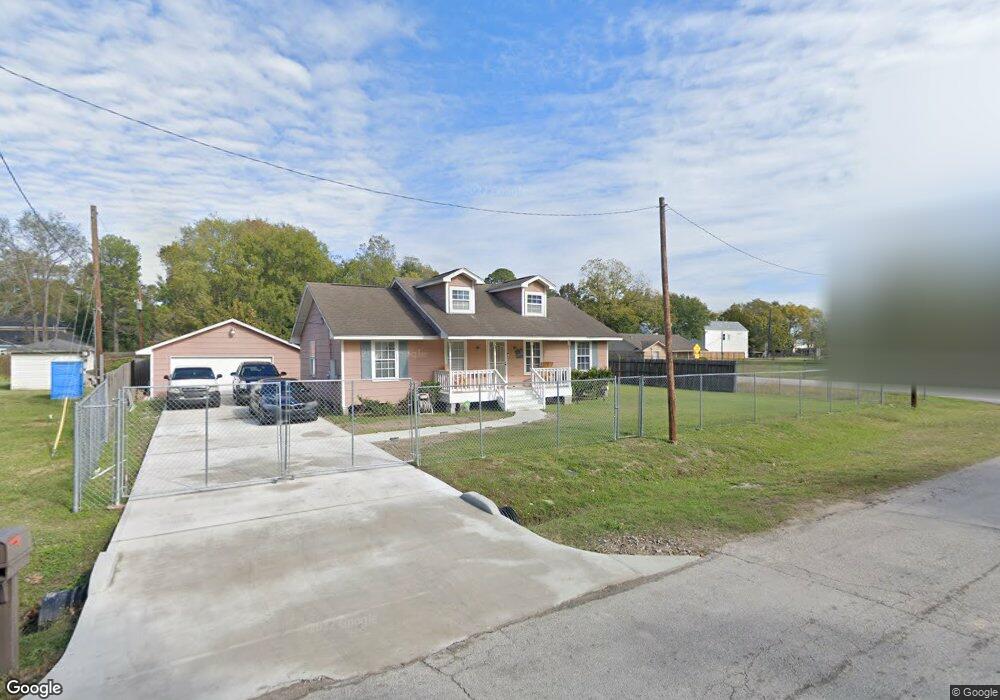
2630 Garfield St Houston, TX 77088
Greater Inwood NeighborhoodEstimated Value: $207,328 - $222,000
3
Beds
2
Baths
1,232
Sq Ft
$173/Sq Ft
Est. Value
About This Home
This home is located at 2630 Garfield St, Houston, TX 77088 and is currently estimated at $213,082, approximately $172 per square foot. 2630 Garfield St is a home located in Harris County with nearby schools including Reece Academy, Anderson Academy, and Houston Academy.
Ownership History
Date
Name
Owned For
Owner Type
Purchase Details
Closed on
Feb 17, 2012
Sold by
The Bank Of New York Mellon
Bought by
Buckner Gloria
Current Estimated Value
Purchase Details
Closed on
May 5, 2009
Sold by
Shelby Tamara
Bought by
The Bank Of New York Mellon and The Bank Of New York
Purchase Details
Closed on
Aug 3, 2005
Sold by
Buckner John
Bought by
Shelby Tamara
Home Financials for this Owner
Home Financials are based on the most recent Mortgage that was taken out on this home.
Original Mortgage
$21,000
Interest Rate
5.65%
Mortgage Type
Stand Alone Second
Purchase Details
Closed on
Jul 29, 2005
Sold by
Hartsfield Billy
Bought by
Buckner John B
Home Financials for this Owner
Home Financials are based on the most recent Mortgage that was taken out on this home.
Original Mortgage
$21,000
Interest Rate
5.65%
Mortgage Type
Stand Alone Second
Purchase Details
Closed on
Mar 19, 2005
Sold by
Buckner John B
Bought by
Hartsfield Billy
Create a Home Valuation Report for This Property
The Home Valuation Report is an in-depth analysis detailing your home's value as well as a comparison with similar homes in the area
Home Values in the Area
Average Home Value in this Area
Purchase History
| Date | Buyer | Sale Price | Title Company |
|---|---|---|---|
| Buckner Gloria | -- | First American Title | |
| The Bank Of New York Mellon | $52,062 | None Available | |
| Shelby Tamara | -- | -- | |
| Buckner John | -- | -- | |
| Buckner John B | -- | -- | |
| Hartsfield Billy | -- | -- |
Source: Public Records
Mortgage History
| Date | Status | Borrower | Loan Amount |
|---|---|---|---|
| Previous Owner | Buckner John | $21,000 | |
| Previous Owner | Shelby Tamara | $84,000 |
Source: Public Records
Tax History Compared to Growth
Tax History
| Year | Tax Paid | Tax Assessment Tax Assessment Total Assessment is a certain percentage of the fair market value that is determined by local assessors to be the total taxable value of land and additions on the property. | Land | Improvement |
|---|---|---|---|---|
| 2025 | $4,962 | $208,554 | $69,026 | $139,528 |
| 2024 | $4,962 | $218,630 | $69,026 | $149,604 |
| 2023 | $4,962 | $187,301 | $69,026 | $118,275 |
| 2022 | $3,596 | $149,910 | $38,500 | $111,410 |
| 2021 | $2,520 | $100,331 | $22,000 | $78,331 |
| 2020 | $2,331 | $88,315 | $13,750 | $74,565 |
| 2019 | $2,161 | $78,095 | $1,650 | $76,445 |
| 2018 | $1,101 | $76,706 | $1,650 | $75,056 |
| 2017 | $2,035 | $76,706 | $1,650 | $75,056 |
| 2016 | $2,035 | $76,706 | $1,650 | $75,056 |
| 2015 | $2,041 | $76,706 | $1,650 | $75,056 |
| 2014 | $2,041 | $76,706 | $1,650 | $75,056 |
Source: Public Records
Map
Nearby Homes
- 8015 Venus St Unit A/B
- 8101 Venus St Unit A/B
- 7903 Sunnyhill St
- 8010 Easter St
- 7926 Easter St
- 8210 Venus St
- 8303 Venus St
- 00 Observatory St
- 8337 Sunnyhill St
- 3306 Elmcrest Dr
- 3414 Lemon Tree Ln
- 8421 Venus St Unit A B
- 8112 Carver Rd
- 7726 Ashmole Ln
- 8205 Carver Rd Unit A/B
- 2819 Rigel Rd
- 5815 Morehouse Ln
- 2409 Wall St
- 7504 Carver Rd Unit D
- 3522 Almington Ln
- 8015 Venus St
- 8002 Venus St
- 8219 Venus St
- 8313 Venus St
- 2715 Garfield St
- 8008 Venus St
- 7930 Garfield St
- 8027 Venus St
- 8011 Sunnyhill St
- 7939 Sunnyhill St
- 7939 Sunnyhill St
- 8015 Sunnyhill St
- 8021 Easter St
- 7912 Sunnyhill St
- 8024 Venus St
- 8032 Sunnyhill St
- 8019 Sunnyhill St
- 7935 Sunnyhill St
- 8034 Sunnyhill St
- 8320 Sunnyhill St