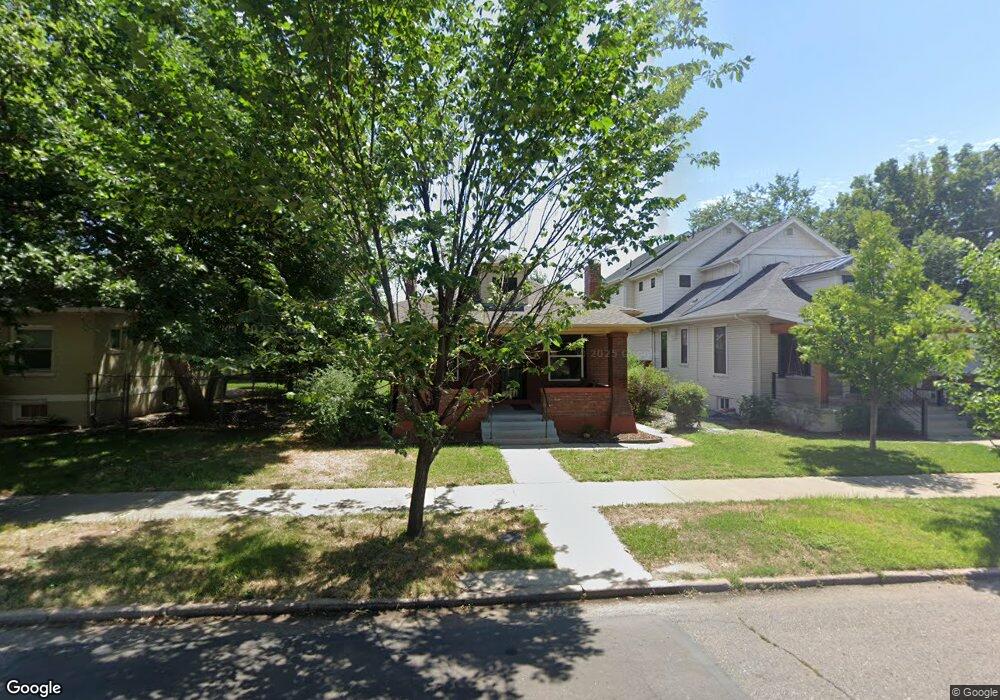
2630 Java Ct Denver, CO 80211
Sloan Lake NeighborhoodEstimated Value: $558,000 - $694,000
1
Bed
1
Bath
737
Sq Ft
$855/Sq Ft
Est. Value
About This Home
This home is located at 2630 Java Ct, Denver, CO 80211 and is currently estimated at $629,820, approximately $854 per square foot. 2630 Java Ct is a home located in Denver County with nearby schools including Brown International Academy, Bryant Webster Dual Language School, and Skinner Middle School.
Ownership History
Date
Name
Owned For
Owner Type
Purchase Details
Closed on
Apr 2, 2022
Sold by
Gonzales Vincent G and Gonzales Charlotte
Bought by
Preserve Trust
Current Estimated Value
Purchase Details
Closed on
Oct 2, 2018
Sold by
Snowball Tree Llc
Bought by
Gonzales Vincent G and Gonzales Charlotte
Purchase Details
Closed on
Aug 2, 2018
Sold by
Gonzalez Rebecca
Bought by
Gonzalez Vincenjt
Purchase Details
Closed on
May 23, 2018
Sold by
Gonzalez Vincent G and Snowball Tree Llc
Bought by
Gonzalez Charlote C and Gonzalez Vincent G
Purchase Details
Closed on
May 22, 2018
Sold by
Gonzalez Rebecca
Bought by
Gonzales Vincent G
Purchase Details
Closed on
Jul 30, 2014
Sold by
Gonzales Vincent G
Bought by
Snowball Tree Llc
Purchase Details
Closed on
May 1, 2009
Sold by
Gonzales George V
Bought by
Gonzales Vincent G
Create a Home Valuation Report for This Property
The Home Valuation Report is an in-depth analysis detailing your home's value as well as a comparison with similar homes in the area
Home Values in the Area
Average Home Value in this Area
Purchase History
| Date | Buyer | Sale Price | Title Company |
|---|---|---|---|
| Preserve Trust | -- | None Listed On Document | |
| Gonzales Vincent G | -- | None Available | |
| Gonzalez Vincenjt | -- | None Available | |
| Gonzalez Charlote C | -- | None Available | |
| Gonzales Vincent G | -- | None Available | |
| Snowball Tree Llc | -- | None Available | |
| Gonzales Vincent G | -- | None Available |
Source: Public Records
Tax History
| Year | Tax Paid | Tax Assessment Tax Assessment Total Assessment is a certain percentage of the fair market value that is determined by local assessors to be the total taxable value of land and additions on the property. | Land | Improvement |
|---|---|---|---|---|
| 2025 | $3,491 | $51,140 | $40,570 | $40,570 |
| 2024 | $3,491 | $44,080 | $35,600 | $8,480 |
| 2023 | $3,416 | $44,080 | $35,600 | $8,480 |
| 2022 | $2,877 | $36,180 | $33,340 | $2,840 |
| 2021 | $2,777 | $37,220 | $34,300 | $2,920 |
| 2020 | $2,565 | $34,570 | $28,590 | $5,980 |
| 2019 | $2,493 | $34,570 | $28,590 | $5,980 |
| 2018 | $2,085 | $26,950 | $23,030 | $3,920 |
| 2017 | $2,079 | $26,950 | $23,030 | $3,920 |
| 2016 | $1,931 | $23,680 | $19,096 | $4,584 |
| 2015 | $1,850 | $23,680 | $19,096 | $4,584 |
| 2014 | $1,659 | $19,980 | $14,026 | $5,954 |
Source: Public Records
Map
Nearby Homes
- 2542 Irving St
- 2453 Julian St
- 3200 W 27th Ave
- 2712 Irving St
- 3153 W 26th Ave
- 2429 Hooker St
- 2456 King St
- 2722 Irving St
- 3156 W 25th Ave
- 2352 Irving St
- 3144 W 25th Ave
- 2339 N Irving St
- 2337 N Irving St
- 2336 Irving St
- 2343 Julian St
- 2501 Grove St Unit 104
- 2501 Grove St Unit 101
- 2501 Grove St Unit 206
- 2818 Java Ct
- 3066 W 27th Ave
Your Personal Tour Guide
Ask me questions while you tour the home.