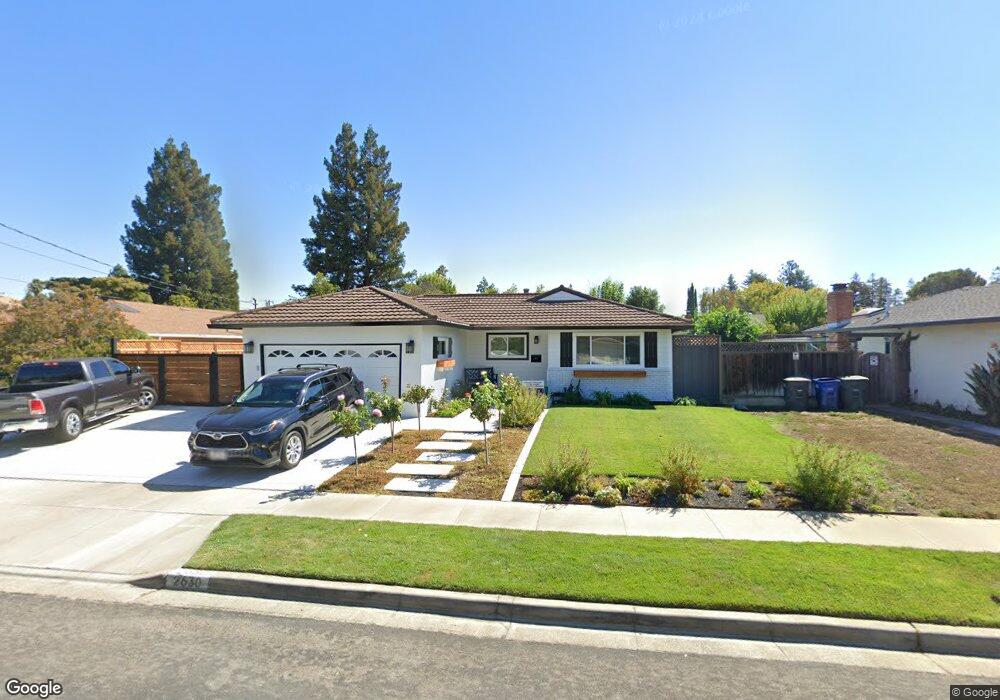
2630 Ryan Rd Concord, CA 94518
Vista Diablo/Wilshire Estates NeighborhoodEstimated Value: $839,993 - $893,000
3
Beds
2
Baths
1,266
Sq Ft
$680/Sq Ft
Est. Value
About This Home
This home is located at 2630 Ryan Rd, Concord, CA 94518 and is currently estimated at $861,498, approximately $680 per square foot. 2630 Ryan Rd is a home located in Contra Costa County with nearby schools including Woodside Elementary School, Oak Grove Middle School, and Ygnacio Valley High School.
Ownership History
Date
Name
Owned For
Owner Type
Purchase Details
Closed on
Mar 19, 2020
Sold by
Spencer Mark T and Spencer Nicole
Bought by
Easton Molly and Easton Derrick
Current Estimated Value
Home Financials for this Owner
Home Financials are based on the most recent Mortgage that was taken out on this home.
Original Mortgage
$527,000
Outstanding Balance
$465,844
Interest Rate
3.4%
Mortgage Type
New Conventional
Estimated Equity
$395,654
Purchase Details
Closed on
Feb 12, 2020
Sold by
Spencer Mark T
Bought by
Spencer Mark T and Spencer Nicole
Home Financials for this Owner
Home Financials are based on the most recent Mortgage that was taken out on this home.
Original Mortgage
$527,000
Outstanding Balance
$465,844
Interest Rate
3.4%
Mortgage Type
New Conventional
Estimated Equity
$395,654
Purchase Details
Closed on
Jul 24, 2008
Sold by
Baker Marlene A
Bought by
Baker Marlene A
Purchase Details
Closed on
Jun 25, 2004
Sold by
Baker Byron T and Baker Marlene Ann
Bought by
Baker Byron T and Baker Marlene A
Create a Home Valuation Report for This Property
The Home Valuation Report is an in-depth analysis detailing your home's value as well as a comparison with similar homes in the area
Home Values in the Area
Average Home Value in this Area
Purchase History
| Date | Buyer | Sale Price | Title Company |
|---|---|---|---|
| Easton Molly | $620,000 | Fidelity National Title Co | |
| Spencer Mark T | -- | None Available | |
| Spencer Mark T | -- | None Available | |
| Baker Marlene A | -- | None Available | |
| Baker Byron T | -- | -- |
Source: Public Records
Mortgage History
| Date | Status | Borrower | Loan Amount |
|---|---|---|---|
| Open | Easton Molly | $527,000 |
Source: Public Records
Tax History
| Year | Tax Paid | Tax Assessment Tax Assessment Total Assessment is a certain percentage of the fair market value that is determined by local assessors to be the total taxable value of land and additions on the property. | Land | Improvement |
|---|---|---|---|---|
| 2025 | $8,419 | $678,056 | $481,202 | $196,854 |
| 2024 | $8,051 | $664,762 | $471,767 | $192,995 |
| 2023 | $8,051 | $651,728 | $462,517 | $189,211 |
| 2022 | $7,945 | $638,950 | $453,449 | $185,501 |
| 2021 | $7,750 | $626,422 | $444,558 | $181,864 |
| 2019 | $1,525 | $77,304 | $28,981 | $48,323 |
| 2018 | $1,450 | $75,789 | $28,413 | $47,376 |
| 2017 | $1,381 | $74,304 | $27,856 | $46,448 |
| 2016 | $1,374 | $72,848 | $27,310 | $45,538 |
| 2015 | $1,254 | $71,754 | $26,900 | $44,854 |
| 2014 | $1,195 | $70,350 | $26,374 | $43,976 |
Source: Public Records
Map
Nearby Homes
- 2605 Ryan Rd
- 3055 Treat Blvd Unit 36
- 810 Oak Grove Rd Unit 104
- 825 Oak Grove Rd Unit 17
- 825 Oak Grove Rd Unit 46
- 825 Oak Grove Rd Unit 62
- 2745 Minert Rd
- 880 Madigan Ave
- 2036 Rockne Dr
- 2840 Royal Ann Ln
- 2890 Treat Blvd Unit 5
- 3181 Santa Maria Dr
- 875 Brittany Ln
- 1766 Risdon Rd
- 3215 Peachwillow Ln
- 1921 Gilly Ln
- 1036 Oak Grove Rd Unit 23
- 1036 Oak Grove Rd Unit 86
- 1036 Oak Grove Rd Unit 21
- 1674 Kasba St
Your Personal Tour Guide
Ask me questions while you tour the home.