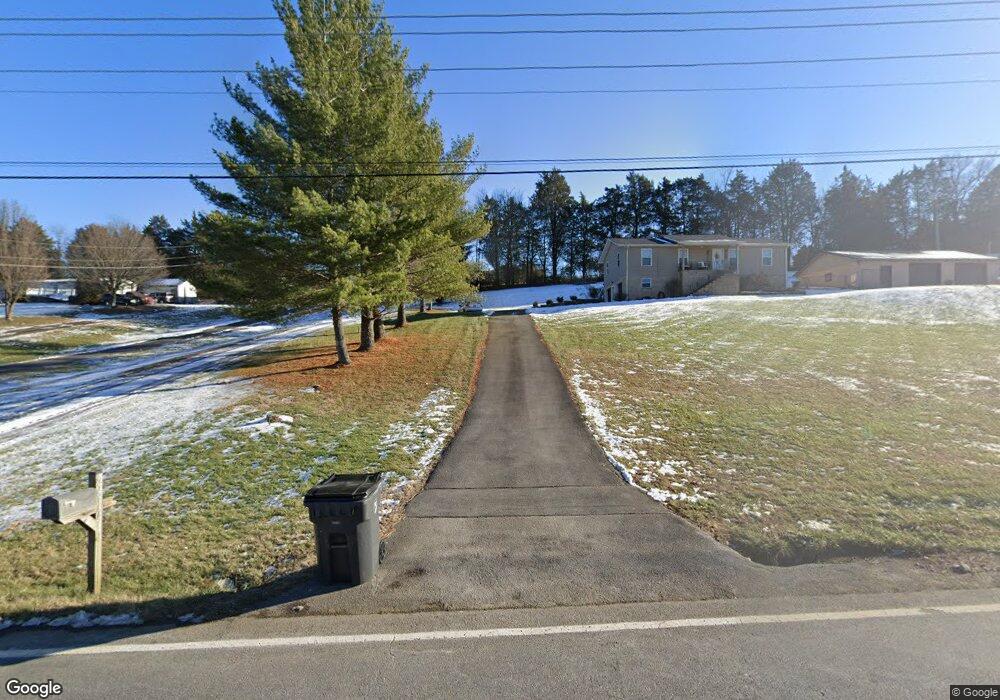
2630 Springvale Rd Morristown, TN 37813
Estimated Value: $246,000 - $324,000
--
Bed
2
Baths
1,680
Sq Ft
$169/Sq Ft
Est. Value
About This Home
This home is located at 2630 Springvale Rd, Morristown, TN 37813 and is currently estimated at $284,000, approximately $169 per square foot. 2630 Springvale Rd is a home located in Hamblen County with nearby schools including Union Heights Elementary School, East Ridge Middle School, and Morristown East High School.
Ownership History
Date
Name
Owned For
Owner Type
Purchase Details
Closed on
Sep 12, 2019
Sold by
Garner Michael
Bought by
Garner Robin Sue
Current Estimated Value
Purchase Details
Closed on
Feb 6, 2009
Sold by
Deutsche Bank National Tru
Bought by
Garner Michael
Purchase Details
Closed on
Jan 10, 2008
Sold by
Nationwide Trustee Svcs In
Bought by
Deutsche Bank National Trust C
Purchase Details
Closed on
Oct 28, 1997
Sold by
Dalton and Carolyn
Bought by
Colley Tracy
Home Financials for this Owner
Home Financials are based on the most recent Mortgage that was taken out on this home.
Original Mortgage
$57,600
Interest Rate
7.31%
Purchase Details
Closed on
Aug 4, 1992
Bought by
Dalton Larry and Dalton Carolyn
Purchase Details
Closed on
Aug 6, 1990
Bought by
Jackson Charles
Purchase Details
Closed on
Apr 2, 1990
Bought by
Overholt Dale and Myers Dearl
Purchase Details
Closed on
Jun 16, 1982
Bought by
Thompson Ralph E and Thompson Dorothy B
Create a Home Valuation Report for This Property
The Home Valuation Report is an in-depth analysis detailing your home's value as well as a comparison with similar homes in the area
Home Values in the Area
Average Home Value in this Area
Purchase History
| Date | Buyer | Sale Price | Title Company |
|---|---|---|---|
| Garner Robin Sue | -- | None Available | |
| Garner Michael | $44,900 | -- | |
| Deutsche Bank National Trust C | $77,633 | -- | |
| Colley Tracy | $72,000 | -- | |
| Dalton Larry | $15,000 | -- | |
| Jackson Charles | $21,300 | -- | |
| Overholt Dale | $78,000 | -- | |
| Thompson Ralph E | -- | -- |
Source: Public Records
Mortgage History
| Date | Status | Borrower | Loan Amount |
|---|---|---|---|
| Previous Owner | Thompson Ralph E | $57,600 |
Source: Public Records
Tax History Compared to Growth
Tax History
| Year | Tax Paid | Tax Assessment Tax Assessment Total Assessment is a certain percentage of the fair market value that is determined by local assessors to be the total taxable value of land and additions on the property. | Land | Improvement |
|---|---|---|---|---|
| 2024 | $627 | $31,825 | $10,100 | $21,725 |
| 2023 | $627 | $31,825 | $0 | $0 |
| 2022 | $627 | $31,825 | $10,100 | $21,725 |
| 2021 | $627 | $31,825 | $10,100 | $21,725 |
| 2020 | $627 | $31,825 | $10,100 | $21,725 |
| 2019 | $525 | $24,625 | $9,725 | $14,900 |
| 2018 | $525 | $24,625 | $9,725 | $14,900 |
| 2017 | $525 | $24,625 | $9,725 | $14,900 |
| 2016 | $490 | $24,625 | $9,725 | $14,900 |
| 2015 | $456 | $24,625 | $9,725 | $14,900 |
| 2014 | -- | $24,625 | $9,725 | $14,900 |
| 2013 | -- | $28,950 | $0 | $0 |
Source: Public Records
Map
Nearby Homes
- 0 Springvale Rd
- 2840-2830 Robinson Creek Rd
- 2205 Kingswood Dr
- 2280 Kingswood Dr
- 2137 Highview Dr
- 2036 River View Dr
- 2034 River View Dr
- 2034 River View Dr Unit 1
- 4520 Enka Hwy
- 3080 Chucky River Rd
- 58/Ac Tbd River View Dr
- 58/Ac Tbd River View Dr Unit 2
- 4207 Clyde Thomas Rd
- 0 Tbd River View Dr Unit Lot@WP001
- 1744 Carroll Rd
- 2945 Enka Hwy
- 1051 Wilson Hale Rd
- 1256 Arden Ln
- 1496 Dover Rd
- 0 Thompson Creek Rd
- 2650 Springvale Rd
- 2614 Springvale Rd
- 2670 Springvale Rd
- 2570 Springvale Rd
- 2671 Springvale Rd
- 2750 Springvale Rd
- 2550 Springvale Rd
- 2675 Springvale Rd
- 2433 Springvale Rd
- 2449 Springvale Rd
- 2851 Springvale Rd
- 2424 Springvale Rd
- 2855 Springvale Rd
- 2445 Springvale Rd
- 2878 Springvale Rd
- 2878 Springvale Rd
- 2636 Robin Cir
- 2736 Springvale Rd
- 2430 Talley Rd
- 2647 Robin Cir