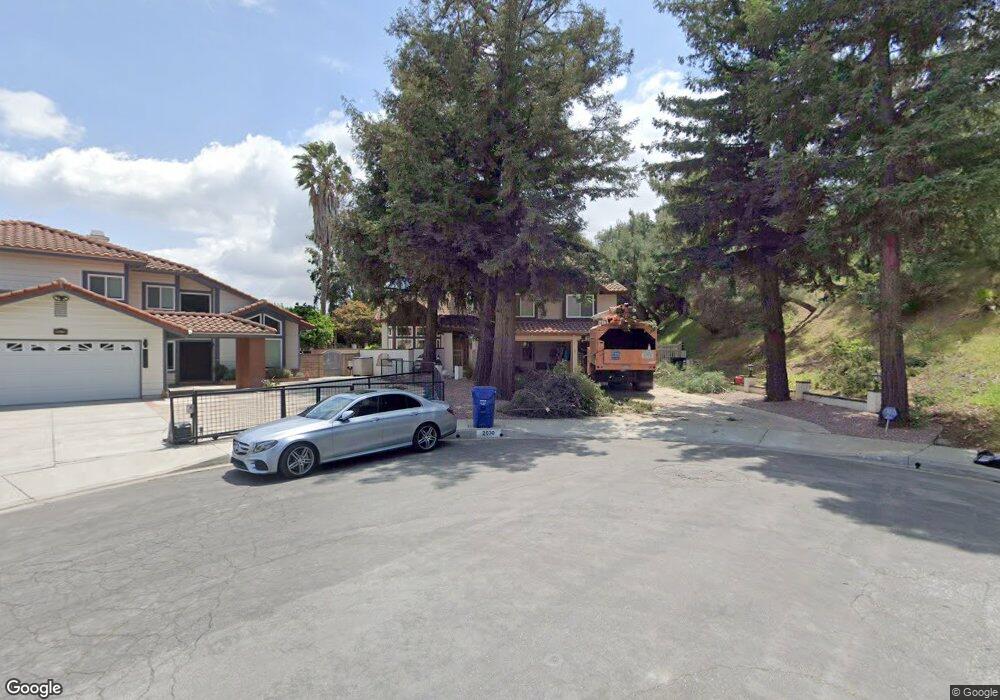
2630 Winrow Ct Rowland Heights, CA 91748
Estimated Value: $1,424,000 - $1,474,000
4
Beds
3
Baths
3,232
Sq Ft
$447/Sq Ft
Est. Value
About This Home
This home is located at 2630 Winrow Ct, Rowland Heights, CA 91748 and is currently estimated at $1,445,933, approximately $447 per square foot. 2630 Winrow Ct is a home located in Los Angeles County with nearby schools including Alvarado Intermediate School, John A. Rowland High School, and Southlands Christian Schools.
Ownership History
Date
Name
Owned For
Owner Type
Purchase Details
Closed on
Feb 14, 2020
Sold by
Leach Barbara J
Bought by
Leach Barbara Jean and Leach Barbara Jean
Current Estimated Value
Home Financials for this Owner
Home Financials are based on the most recent Mortgage that was taken out on this home.
Original Mortgage
$423,500
Interest Rate
3.6%
Mortgage Type
New Conventional
Purchase Details
Closed on
Sep 12, 2016
Sold by
Leach Barbara Jean
Bought by
Leach Barbara Jean and The Barbara Jean Leach Revocab
Purchase Details
Closed on
Oct 16, 2012
Sold by
Leach Barbara J
Bought by
Leach Barbara J
Home Financials for this Owner
Home Financials are based on the most recent Mortgage that was taken out on this home.
Original Mortgage
$417,000
Interest Rate
3.5%
Mortgage Type
New Conventional
Purchase Details
Closed on
Oct 30, 2008
Sold by
Leach Gary E
Bought by
Leah Barbara J
Create a Home Valuation Report for This Property
The Home Valuation Report is an in-depth analysis detailing your home's value as well as a comparison with similar homes in the area
Home Values in the Area
Average Home Value in this Area
Purchase History
| Date | Buyer | Sale Price | Title Company |
|---|---|---|---|
| Leach Barbara Jean | -- | Netco Title Company | |
| Leach Barbara J | -- | Netco Title Company | |
| Leach Barbara Jean | -- | None Available | |
| Leach Barbara J | -- | Title 365 | |
| Leah Barbara J | -- | None Available |
Source: Public Records
Mortgage History
| Date | Status | Borrower | Loan Amount |
|---|---|---|---|
| Closed | Leach Barbara J | $423,500 | |
| Closed | Leach Barbara J | $417,000 |
Source: Public Records
Tax History Compared to Growth
Tax History
| Year | Tax Paid | Tax Assessment Tax Assessment Total Assessment is a certain percentage of the fair market value that is determined by local assessors to be the total taxable value of land and additions on the property. | Land | Improvement |
|---|---|---|---|---|
| 2025 | $7,182 | $558,118 | $111,695 | $446,423 |
| 2024 | $7,182 | $547,175 | $109,505 | $437,670 |
| 2023 | $6,946 | $536,447 | $107,358 | $429,089 |
| 2022 | $6,793 | $525,929 | $105,253 | $420,676 |
| 2021 | $6,669 | $515,618 | $103,190 | $412,428 |
| 2019 | $6,469 | $500,327 | $100,130 | $400,197 |
| 2018 | $6,178 | $490,517 | $98,167 | $392,350 |
| 2016 | $5,921 | $471,471 | $94,356 | $377,115 |
| 2015 | $5,825 | $464,390 | $92,939 | $371,451 |
| 2014 | $5,820 | $455,294 | $91,119 | $364,175 |
Source: Public Records
Map
Nearby Homes
- 2503 Donosa Dr
- 2330 Donosa Dr
- 17812 Gallineta St
- 17712 Nearbank Dr
- 18220 Gallineta St
- 18239 Villa Clara St
- 2048 Calle Bogota
- 2426 Batson Ave
- 17834 Calle Los Arboles
- 18109 Graystone Way
- 2474 Patrician View Ave
- 18536 Mescal St
- 2521 Doubletree Ln
- 1808 Via Entrada
- 2306 Doubletree Ln
- 18131 Camino Bello Unit 4
- 18138 Via Amorosa Unit 4
- 18225 Camino Bello Unit 4
- 2010 La Cueva Dr
- 18489 Stonegate Ln
- 2620 Winrow Ct
- 2641 Legend Ln
- 2631 Legend Ln
- 17935 Crimson Crest Dr
- 17939 Crimson Crest Dr
- 2621 Legend Ln
- 2610 Winrow Ct
- 2651 Legend Ln
- 2611 Winrow Ct
- 17927 Crimson Crest Dr
- 2611 Legend Ln
- 2661 Legend Ln
- 2600 Winrow Ct
- 17940 Crimson Crest Dr
- 17921 Crimson Crest Dr
- 17991 Sunrise Dr
- 2601 Legend Ln
- 18005 Cocklebur Place
- 2601 Winrow Ct
- 17995 Sunrise Dr