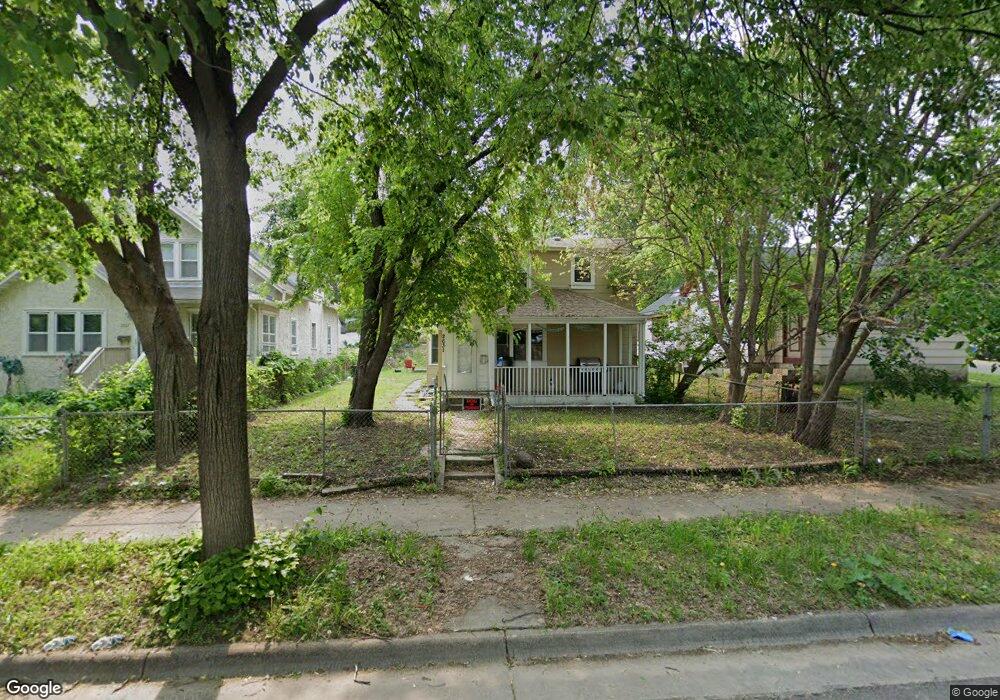
2631 N 3rd St Minneapolis, MN 55411
Hawthorne NeighborhoodEstimated Value: $190,000 - $226,000
3
Beds
2
Baths
1,196
Sq Ft
$171/Sq Ft
Est. Value
About This Home
This home is located at 2631 N 3rd St, Minneapolis, MN 55411 and is currently estimated at $204,626, approximately $171 per square foot. 2631 N 3rd St is a home located in Hennepin County with nearby schools including Nellie Stone Johnson Elementary School, Anwatin Middle School, and North Community High School.
Ownership History
Date
Name
Owned For
Owner Type
Purchase Details
Closed on
Apr 7, 2017
Sold by
Lopez Fernando Rodriguez and Rodriguez Lopez Lizeht R
Bought by
Bryan Ian M
Current Estimated Value
Home Financials for this Owner
Home Financials are based on the most recent Mortgage that was taken out on this home.
Original Mortgage
$120,269
Outstanding Balance
$99,834
Interest Rate
4.12%
Mortgage Type
FHA
Estimated Equity
$104,792
Purchase Details
Closed on
Jul 10, 2015
Bought by
Lopez Fernando Fernando
Home Financials for this Owner
Home Financials are based on the most recent Mortgage that was taken out on this home.
Original Mortgage
$107,400
Interest Rate
4.04%
Purchase Details
Closed on
Jun 2, 2014
Sold by
Kaja Holdings 2 Llc
Bought by
Watt Global Investment Llc
Purchase Details
Closed on
Dec 26, 2013
Sold by
U S Bank National Association
Bought by
Kaja Holdings 2 Llc
Purchase Details
Closed on
Jan 21, 2013
Sold by
Hines Edward M
Bought by
Us Bank National Association
Purchase Details
Closed on
Aug 21, 2006
Sold by
Jones Debra J
Bought by
Hines Edward M
Create a Home Valuation Report for This Property
The Home Valuation Report is an in-depth analysis detailing your home's value as well as a comparison with similar homes in the area
Home Values in the Area
Average Home Value in this Area
Purchase History
| Date | Buyer | Sale Price | Title Company |
|---|---|---|---|
| Bryan Ian M | $126,200 | Executive Title Services Inc | |
| Lopez Fernando Fernando | $109,900 | -- | |
| Watt Global Investment Llc | $14,000 | None Available | |
| Kaja Holdings 2 Llc | $8,925 | Multiple | |
| -- | $8,900 | -- | |
| Us Bank National Association | $45,689 | None Available | |
| Hines Edward M | $130,000 | -- |
Source: Public Records
Mortgage History
| Date | Status | Borrower | Loan Amount |
|---|---|---|---|
| Open | Bryan Ian M | $120,269 | |
| Previous Owner | Lopez Fernando Fernando | $107,400 |
Source: Public Records
Tax History Compared to Growth
Tax History
| Year | Tax Paid | Tax Assessment Tax Assessment Total Assessment is a certain percentage of the fair market value that is determined by local assessors to be the total taxable value of land and additions on the property. | Land | Improvement |
|---|---|---|---|---|
| 2024 | $1,979 | $162,000 | $14,000 | $148,000 |
| 2023 | $1,862 | $163,000 | $14,000 | $149,000 |
| 2022 | $2,203 | $155,000 | $12,000 | $143,000 |
| 2021 | $2,001 | $148,000 | $9,000 | $139,000 |
| 2020 | $2,149 | $136,500 | $10,800 | $125,700 |
| 2019 | $1,706 | $124,000 | $7,200 | $116,800 |
| 2018 | $966 | $103,500 | $7,200 | $96,300 |
| 2017 | $1,332 | $86,500 | $6,500 | $80,000 |
| 2016 | $1,983 | $70,000 | $6,500 | $63,500 |
| 2015 | $1,735 | $49,000 | $6,500 | $42,500 |
| 2014 | -- | $47,500 | $7,900 | $39,600 |
Source: Public Records
Map
Nearby Homes
- 2718 N 4th St
- 2407 N 4th St
- 2410 Lyndale Ave N
- 306 23rd Ave N
- 2806 Aldrich Ave N
- 2704 Bryant Ave N
- 2800 Bryant Ave N
- 2634 Colfax Ave N
- 2906 Bryant Ave N
- 2957 Lyndale Ave N
- 2905 Bryant Ave N
- 2913 Bryant Ave N
- 2630 Dupont Ave N
- 735 31st Ave N
- 2323 Dupont Ave N
- 3222 N 6th St
- 2214 Dupont Ave N
- 1105 25th Ave N
- 3219 Lyndale Ave N
- 2924 Emerson Ave N
- 2635 N 3rd St
- 2627 N 3rd St
- 2621 N 3rd St
- 2619-17-11 N 3rd St
- 2619 N 3rd St
- 2617 N 3rd St
- 2701 N 3rd St
- 2701 2701 3rd-Street-n
- 2630 N 4th St
- 2624 N 4th St
- 2632 N 4th St
- 2622 N 4th St
- 2622 N 4th St Unit 1
- 2705 N 3rd St
- 2611 N 3rd St
- 2618 N 4th St
- 2618 2618 4th-Street-n
- 318 27th Ave N
- 2709 N 3rd St
- 2614 N 4th St