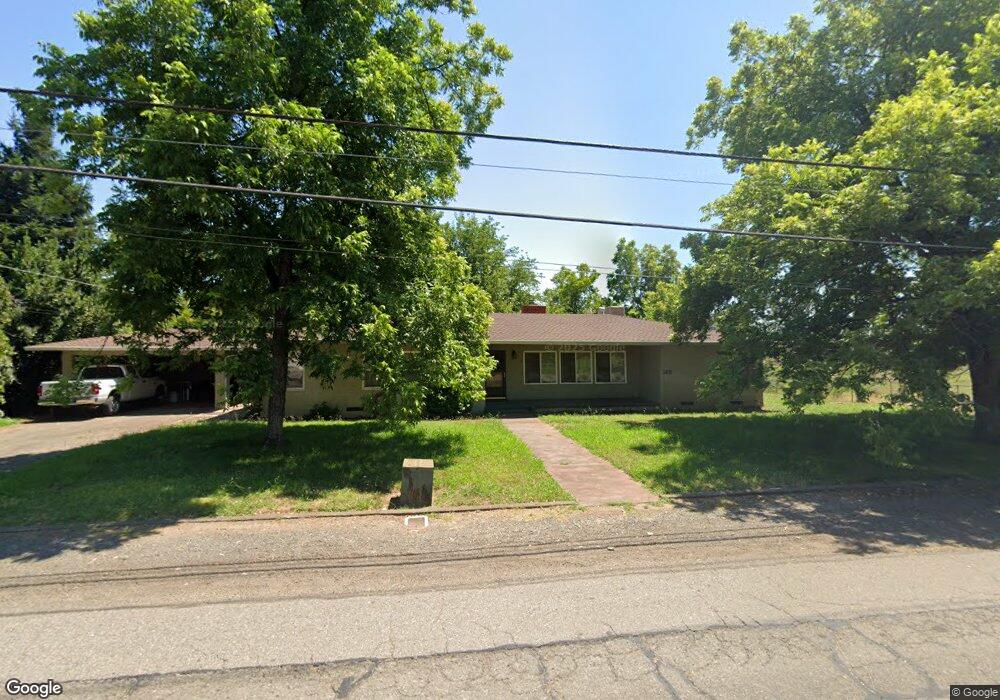
2631 N Bonnyview Rd Redding, CA 96001
Bonnyview NeighborhoodEstimated Value: $429,000 - $654,000
3
Beds
2
Baths
2,795
Sq Ft
$189/Sq Ft
Est. Value
About This Home
This home is located at 2631 N Bonnyview Rd, Redding, CA 96001 and is currently estimated at $527,769, approximately $188 per square foot. 2631 N Bonnyview Rd is a home located in Shasta County with nearby schools including Bonny View Elementary School, Sequoia Middle School, and Shasta High School.
Ownership History
Date
Name
Owned For
Owner Type
Purchase Details
Closed on
Jun 27, 2006
Sold by
Dean Trudy L
Bought by
Dean Trudy L
Current Estimated Value
Purchase Details
Closed on
Nov 16, 2005
Sold by
Dean Troy and Dean Trudy
Bought by
Dean Trudy L
Create a Home Valuation Report for This Property
The Home Valuation Report is an in-depth analysis detailing your home's value as well as a comparison with similar homes in the area
Home Values in the Area
Average Home Value in this Area
Purchase History
| Date | Buyer | Sale Price | Title Company |
|---|---|---|---|
| Dean Trudy L | -- | None Available | |
| Dean Trudy L | -- | None Available |
Source: Public Records
Tax History Compared to Growth
Tax History
| Year | Tax Paid | Tax Assessment Tax Assessment Total Assessment is a certain percentage of the fair market value that is determined by local assessors to be the total taxable value of land and additions on the property. | Land | Improvement |
|---|---|---|---|---|
| 2025 | $2,805 | $268,658 | $101,739 | $166,919 |
| 2024 | $2,762 | $263,392 | $99,745 | $163,647 |
| 2023 | $2,762 | $258,229 | $97,790 | $160,439 |
| 2022 | $2,716 | $253,167 | $95,873 | $157,294 |
| 2021 | $2,703 | $248,204 | $93,994 | $154,210 |
| 2020 | $2,739 | $245,660 | $93,031 | $152,629 |
| 2019 | $2,601 | $240,844 | $91,207 | $149,637 |
| 2018 | $2,624 | $236,122 | $89,419 | $146,703 |
| 2017 | $2,611 | $231,493 | $87,666 | $143,827 |
| 2016 | $2,528 | $226,955 | $85,948 | $141,007 |
| 2015 | $2,496 | $223,546 | $84,657 | $138,889 |
| 2014 | $2,480 | $219,168 | $82,999 | $136,169 |
Source: Public Records
Map
Nearby Homes
- 5211 E Bonnyview Rd
- 2396 Wilsey Dr
- 3385 Pioneer Ln
- 5367 Rosswood Ln
- 0 Lot4 Unit 2 Ph 2 Stillwater Unit 25-4962
- 0 Lot3 Unit 2 Ph 2 Stillwater Unit 25-4961
- 0 Lot6 Unit 2 Ph 2 Stillwater Unit 25-4964
- 0 Lot5 Unit 2 Ph 2 Stillwater Unit 25-4963
- 0 Lot16 Unit 2 Ph 2 Stillwater Unit 25-4958
- 0 Lot9 Unit 2 Ph 2 Stillwater Unit 25-4967
- 0 Lot2 Unit 2 Ph 2 Stillwater Unit 25-4960
- 0 Lot11 Unit 2 Ph 2 Stillwater Unit 25-4953
- 0 Lot10 Unit 2 Ph 2 Stillwater Unit 25-4952
- 0 Lot7 Unit 2 Ph 2 Stillwater Unit 25-4965
- 4549 Harrison Ave
- 5750 Cedars Rd
- 5812 Cedars Rd Unit 36
- 5812 Cedars Rd Unit 3
- 5587 Indianwood Dr
- 0000 Wyndham Pointe Subdivision
- 2626 N Bonnyview Rd
- 2615 N Bonnyview Rd
- 2681 N Bonnyview Rd
- 2672 N Bonnyview Rd
- 2701 N Bonnyview Rd
- 5172 Bidwell Rd
- 5195 Bidwell Rd
- 2711 N Bonnyview Rd
- 5160 /5162 Bidwell Rd
- 5160 Bidwell Rd
- 2728 N Bonnyview Rd
- 2726 N Bonnyview Rd
- 5173 Bidwell Rd
- 5142 E Bonnyview Rd
- 5150 Bidwell Rd
- 2526 N Bonnyview Rd
- 2754 N Bonnyview Rd
- 2761 N Bonnyview Rd
- 5186 E Bonnyview Rd
- 5165 Bidwell Rd