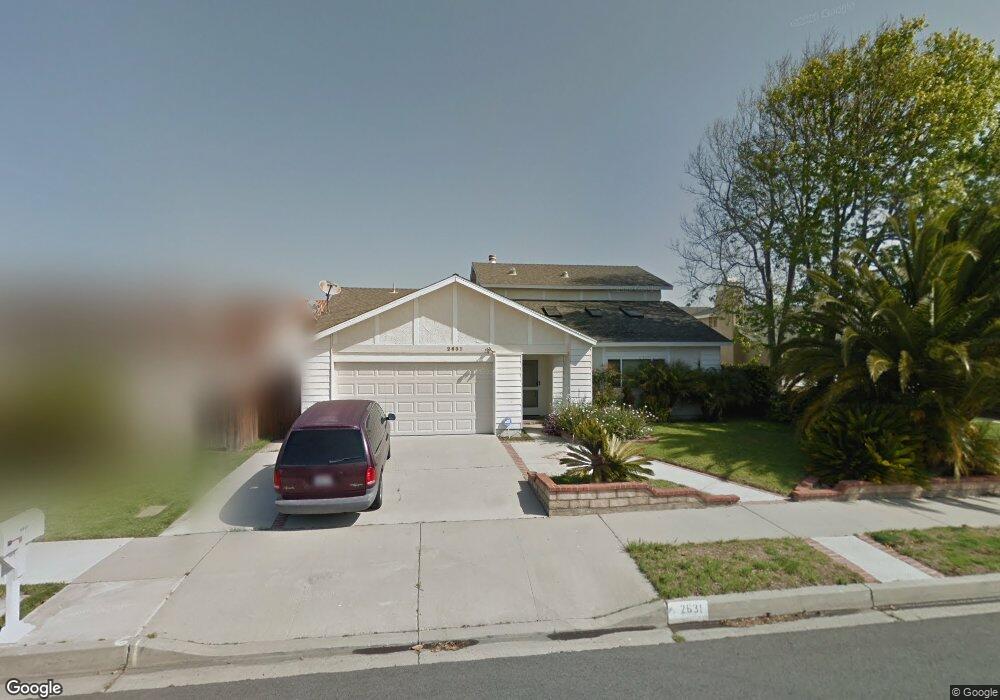
2631 Oarfish Ln Oxnard, CA 93035
Sea Air NeighborhoodEstimated Value: $851,080 - $878,000
4
Beds
3
Baths
1,913
Sq Ft
$453/Sq Ft
Est. Value
About This Home
This home is located at 2631 Oarfish Ln, Oxnard, CA 93035 and is currently estimated at $866,770, approximately $453 per square foot. 2631 Oarfish Ln is a home located in Ventura County with nearby schools including Juan Lagunas Soria Elementary School and Oxnard High School.
Ownership History
Date
Name
Owned For
Owner Type
Purchase Details
Closed on
Jun 16, 2009
Sold by
Zenon Elious and Zenon Jacqueline
Bought by
To Irwin Hei Wai and To Dominica
Current Estimated Value
Home Financials for this Owner
Home Financials are based on the most recent Mortgage that was taken out on this home.
Original Mortgage
$272,000
Interest Rate
5.09%
Mortgage Type
New Conventional
Purchase Details
Closed on
Aug 1, 2000
Sold by
Winters Martha S
Bought by
Zenon Elious and Zenon Jacqueline
Home Financials for this Owner
Home Financials are based on the most recent Mortgage that was taken out on this home.
Original Mortgage
$195,000
Interest Rate
9.75%
Create a Home Valuation Report for This Property
The Home Valuation Report is an in-depth analysis detailing your home's value as well as a comparison with similar homes in the area
Home Values in the Area
Average Home Value in this Area
Purchase History
| Date | Buyer | Sale Price | Title Company |
|---|---|---|---|
| To Irwin Hei Wai | $340,000 | Fidelity National Title Co | |
| Zenon Elious | $260,000 | Lawyers Title Company |
Source: Public Records
Mortgage History
| Date | Status | Borrower | Loan Amount |
|---|---|---|---|
| Previous Owner | To Irwin Hei Wai | $272,000 | |
| Previous Owner | Zenon Elious | $195,000 | |
| Closed | Zenon Elious | $65,000 |
Source: Public Records
Tax History
| Year | Tax Paid | Tax Assessment Tax Assessment Total Assessment is a certain percentage of the fair market value that is determined by local assessors to be the total taxable value of land and additions on the property. | Land | Improvement |
|---|---|---|---|---|
| 2025 | $5,253 | $438,864 | $219,433 | $219,431 |
| 2024 | $5,253 | $430,259 | $215,130 | $215,129 |
| 2023 | $5,060 | $421,823 | $210,912 | $210,911 |
| 2022 | $4,906 | $413,552 | $206,776 | $206,776 |
| 2021 | $4,866 | $405,444 | $202,722 | $202,722 |
| 2020 | $4,955 | $401,290 | $200,645 | $200,645 |
| 2019 | $4,814 | $393,422 | $196,711 | $196,711 |
| 2018 | $4,745 | $385,708 | $192,854 | $192,854 |
| 2017 | $4,502 | $378,146 | $189,073 | $189,073 |
| 2016 | $4,344 | $370,732 | $185,366 | $185,366 |
| 2015 | $4,388 | $365,166 | $182,583 | $182,583 |
| 2014 | $4,424 | $358,014 | $179,007 | $179,007 |
Source: Public Records
Map
Nearby Homes
- 600 Freeport Ln
- 940 Stern Ln
- 2923 Kelp Ln Unit 11
- 2919 Naples Dr
- 1170 Windward Way
- 2900 Windward Way
- 2401 El Portal Way
- 1254 Miramar Walk
- 2213 Miramar Walk
- 2324 Miramar Walk
- 1309 Nautical Way
- 1231 Lost Point Ln
- 1501 Pisco Ln
- 1174 Oyster Place Unit 15
- 3746 Dunkirk Dr
- 807 Kingfisher Way
- 1820 Claremont Dr
- 2941 W Hemlock St Unit 22
- 2400 W Hemlock St
- 2736 Jill Place Unit B
- 2621 Oarfish Ln
- 2701 Oarfish Ln
- 2640 New Haven Place
- 2700 New Haven Place
- 2611 Oarfish Ln
- 2711 Oarfish Ln
- 2630 New Haven Place
- 2710 New Haven Place
- 2630 Oarfish Ln
- 2620 Oarfish Ln
- 2620 New Haven Place
- 2700 Oarfish Ln
- 2601 Oarfish Ln
- 2721 Oarfish Ln
- 2610 Oarfish Ln
- 2720 New Haven Place
- 2710 Oarfish Ln
- 2610 New Haven Place
- 2731 Oarfish Ln
- 2531 Oarfish Ln
Your Personal Tour Guide
Ask me questions while you tour the home.