Estimated Value: $551,000 - $601,000
4
Beds
3
Baths
2,610
Sq Ft
$224/Sq Ft
Est. Value
About This Home
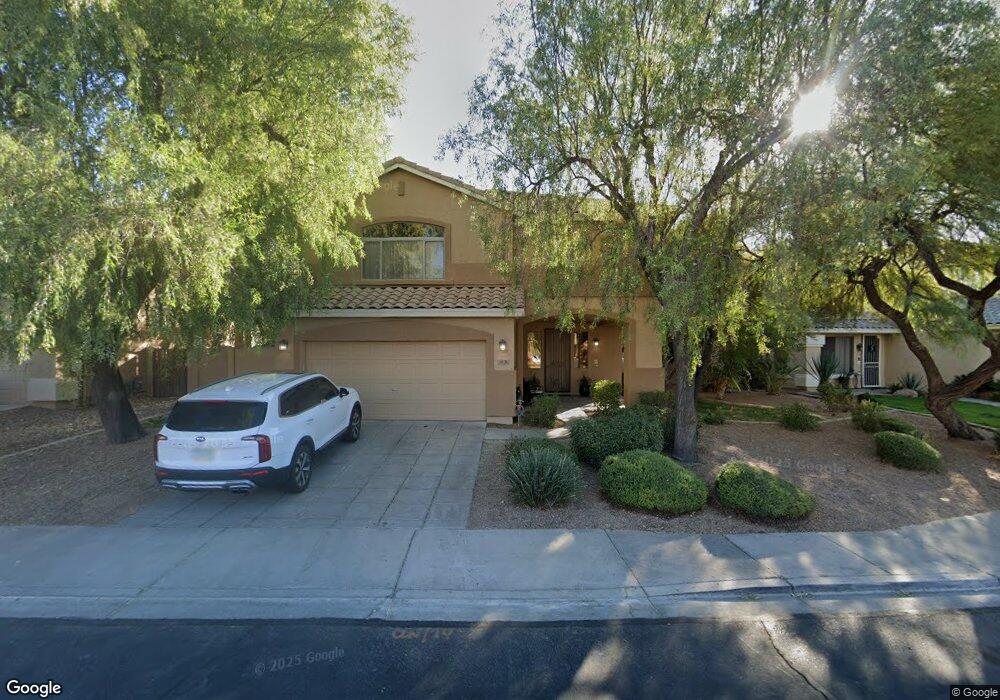
This home is located at 2631 S Keene, Mesa, AZ 85209 and is currently estimated at $584,609, approximately $223 per square foot. 2631 S Keene is a home located in Maricopa County with nearby schools including Augusta Ranch Elementary School, Desert Ridge Jr. High School, and Desert Ridge High School.
Ownership History
Date
Name
Owned For
Owner Type
Purchase Details
Closed on
Mar 27, 2024
Sold by
Julia R Coleman Trust
Bought by
Flores Anthony and Flores Mandy
Current Estimated Value
Home Financials for this Owner
Home Financials are based on the most recent Mortgage that was taken out on this home.
Original Mortgage
$436,000
Outstanding Balance
$429,348
Interest Rate
6.77%
Mortgage Type
New Conventional
Estimated Equity
$155,261
Purchase Details
Closed on
Jul 1, 2015
Sold by
Coleman Julia R
Bought by
Coleman Julia R and Julia R Coleman Trust
Purchase Details
Closed on
Apr 28, 2014
Sold by
Coleman John P and Coleman Julia R
Bought by
Coleman Julia R
Purchase Details
Closed on
Dec 8, 2000
Sold by
U S Home Corp
Bought by
Coleman John P and Coleman Julia R
Home Financials for this Owner
Home Financials are based on the most recent Mortgage that was taken out on this home.
Original Mortgage
$167,900
Interest Rate
7.71%
Mortgage Type
New Conventional
Create a Home Valuation Report for This Property
The Home Valuation Report is an in-depth analysis detailing your home's value as well as a comparison with similar homes in the area
Home Values in the Area
Average Home Value in this Area
Purchase History
| Date | Buyer | Sale Price | Title Company |
|---|---|---|---|
| Flores Anthony | $545,000 | Truly Title | |
| Coleman Julia R | -- | None Available | |
| Coleman Julia R | -- | None Available | |
| Coleman John P | $209,900 | North American Title |
Source: Public Records
Mortgage History
| Date | Status | Borrower | Loan Amount |
|---|---|---|---|
| Open | Flores Anthony | $436,000 | |
| Previous Owner | Coleman John P | $167,900 |
Source: Public Records
Tax History Compared to Growth
Tax History
| Year | Tax Paid | Tax Assessment Tax Assessment Total Assessment is a certain percentage of the fair market value that is determined by local assessors to be the total taxable value of land and additions on the property. | Land | Improvement |
|---|---|---|---|---|
| 2025 | $2,261 | $30,535 | -- | -- |
| 2024 | $2,194 | $29,081 | -- | -- |
| 2023 | $2,194 | $42,550 | $8,510 | $34,040 |
| 2022 | $2,141 | $32,630 | $6,520 | $26,110 |
| 2021 | $2,319 | $31,320 | $6,260 | $25,060 |
| 2020 | $2,279 | $29,170 | $5,830 | $23,340 |
| 2019 | $2,112 | $26,870 | $5,370 | $21,500 |
| 2018 | $2,010 | $25,720 | $5,140 | $20,580 |
| 2017 | $1,947 | $25,160 | $5,030 | $20,130 |
| 2016 | $2,019 | $24,580 | $4,910 | $19,670 |
| 2015 | $1,852 | $24,750 | $4,950 | $19,800 |
Source: Public Records
Map
Nearby Homes
- 2642 S Joplin
- 9513 E Olla Cir
- 9637 E Olla Ave
- 9434 E Osage Ave
- 9316 E Monterey Ave
- 9233 E Neville Ave Unit 1011
- 9233 E Neville Ave Unit 1103
- 9721 E Osage Ave Unit 3
- 9328 E Osage Ave
- 9426 E Los Lagos Vista Ave
- 9831 E Lompoc Ave
- 9822 E Lompoc Ave
- 9566 E Plana Ave Unit II
- 9337 E Kiva Ave
- 2304 S Bernard
- 9326 E Pampa Ave
- 9744 E Pantera Ave
- 2965 S Sierra Heights Unit 216
- 2550 South S Ellsworth Rd Unit 207
- 9959 E Kiowa Ave
- 2637 S Keene
- 2625 S Keene
- 9532 E Natal Ave
- 2619 S Keene
- 9535 E Natal Ave
- 9526 E Natal Ave
- 2613 S Keene
- 9529 E Natal Ave
- 2616 S Keene
- 9520 E Natal Ave
- 2607 S Keene
- 9523 E Natal Ave
- 2610 S Keene
- 9564 E Navarro Ave
- 9560 E Navarro Ave
- 9556 E Navarro Ave
- 9514 E Natal Ave
- 9517 E Natal Ave
- 2601 S Keene
- 2604 S Keene