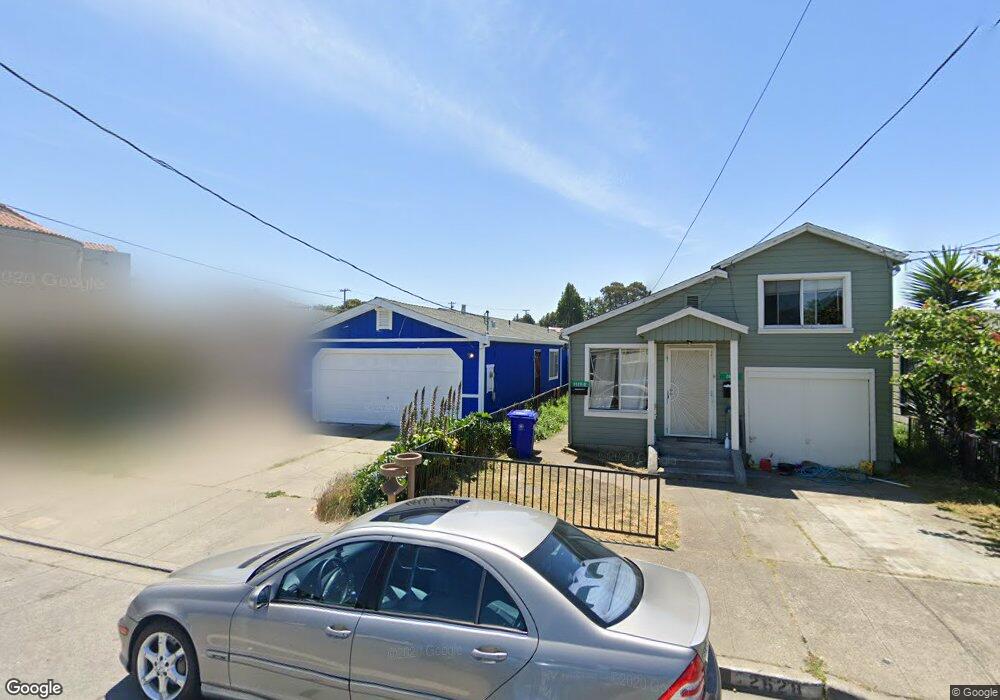
2632 Dover Ave San Pablo, CA 94806
Estimated Value: $507,571 - $601,000
3
Beds
2
Baths
1,139
Sq Ft
$485/Sq Ft
Est. Value
About This Home
This home is located at 2632 Dover Ave, San Pablo, CA 94806 and is currently estimated at $552,393, approximately $484 per square foot. 2632 Dover Ave is a home located in Contra Costa County with nearby schools including Ford Elementary School, Walter T. Helms Middle School, and Richmond High School.
Ownership History
Date
Name
Owned For
Owner Type
Purchase Details
Closed on
Dec 21, 2018
Sold by
Galvez Maria C and Galvez Veronica
Bought by
Galvez Veronica
Current Estimated Value
Home Financials for this Owner
Home Financials are based on the most recent Mortgage that was taken out on this home.
Original Mortgage
$104,996
Outstanding Balance
$92,688
Interest Rate
4.9%
Mortgage Type
New Conventional
Estimated Equity
$459,705
Purchase Details
Closed on
May 28, 1996
Sold by
Glenn Richard A
Bought by
Galvez Maria C and Barrios Veronica Galvez
Home Financials for this Owner
Home Financials are based on the most recent Mortgage that was taken out on this home.
Original Mortgage
$117,000
Interest Rate
7.96%
Mortgage Type
Purchase Money Mortgage
Purchase Details
Closed on
Nov 21, 1995
Sold by
Lanier Barbara L
Bought by
Glenn Richard A
Purchase Details
Closed on
Mar 29, 1995
Sold by
Glenn Marie A
Bought by
Glenn Marie A
Create a Home Valuation Report for This Property
The Home Valuation Report is an in-depth analysis detailing your home's value as well as a comparison with similar homes in the area
Home Values in the Area
Average Home Value in this Area
Purchase History
| Date | Buyer | Sale Price | Title Company |
|---|---|---|---|
| Galvez Veronica | $95,000 | Amrock Title California Inc | |
| Galvez Maria C | $130,000 | Chicago Title Co | |
| Glenn Richard A | -- | -- | |
| Glenn Marie A | -- | -- |
Source: Public Records
Mortgage History
| Date | Status | Borrower | Loan Amount |
|---|---|---|---|
| Open | Galvez Veronica | $104,996 | |
| Previous Owner | Galvez Maria C | $117,000 |
Source: Public Records
Tax History
| Year | Tax Paid | Tax Assessment Tax Assessment Total Assessment is a certain percentage of the fair market value that is determined by local assessors to be the total taxable value of land and additions on the property. | Land | Improvement |
|---|---|---|---|---|
| 2025 | $4,044 | $215,937 | $85,542 | $130,395 |
| 2024 | $3,862 | $211,704 | $83,865 | $127,839 |
| 2023 | $3,862 | $207,554 | $82,221 | $125,333 |
| 2022 | $3,796 | $203,485 | $80,609 | $122,876 |
| 2021 | $3,762 | $199,496 | $79,029 | $120,467 |
| 2019 | $3,568 | $193,581 | $76,686 | $116,895 |
| 2018 | $3,333 | $189,786 | $75,183 | $114,603 |
| 2017 | $3,233 | $186,065 | $73,709 | $112,356 |
| 2016 | $3,163 | $182,417 | $72,264 | $110,153 |
| 2015 | $3,126 | $179,678 | $71,179 | $108,499 |
| 2014 | $3,102 | $176,159 | $69,785 | $106,374 |
Source: Public Records
Map
Nearby Homes
- 2802 Chattleton Ln
- 2814 Chattleton Ln
- 2606 Bush Ave
- 2818 Chattleton Ln
- 2420 Bush Ave
- 2801 Asher Ct
- 2805 Asher Ct
- 2376 Bush Ave
- 2809 Arjan Ct
- 13700 San Pablo Ave Unit 2212
- 13700 San Pablo Ave Unit 1315
- 13700 San Pablo Ave Unit 1210
- 13700 San Pablo Ave Unit 2207
- 1971 23rd St
- 2332 Emeric Ave
- 1945 21st St
- 2121 Vale Rd Unit 31
- 2121 Vale Rd Unit 121
- 2011 Market Ave Unit 317
- 2036 Brookside Dr
- 2628 Dover Ave
- 2634 Dover Ave Unit 2636
- 2622 Dover Ave
- 2614 Dover Ave
- 1862 Pullman St
- 1874 Pullman St
- 1868 Pullman St
- 1860 Pullman St
- 2608 Dover Ave
- 2600 Dover Ave
- 1909 Dodson St
- 1858 Pullman St
- 1848 Pullman St
- 2621 Dover Ave
- 2613 Dover Ave
- 1844 Pullman St
- 1900 Pullman St
- 1921 Dodson St
- 2532 Dover Ave
- 1840 Pullman St
Your Personal Tour Guide
Ask me questions while you tour the home.