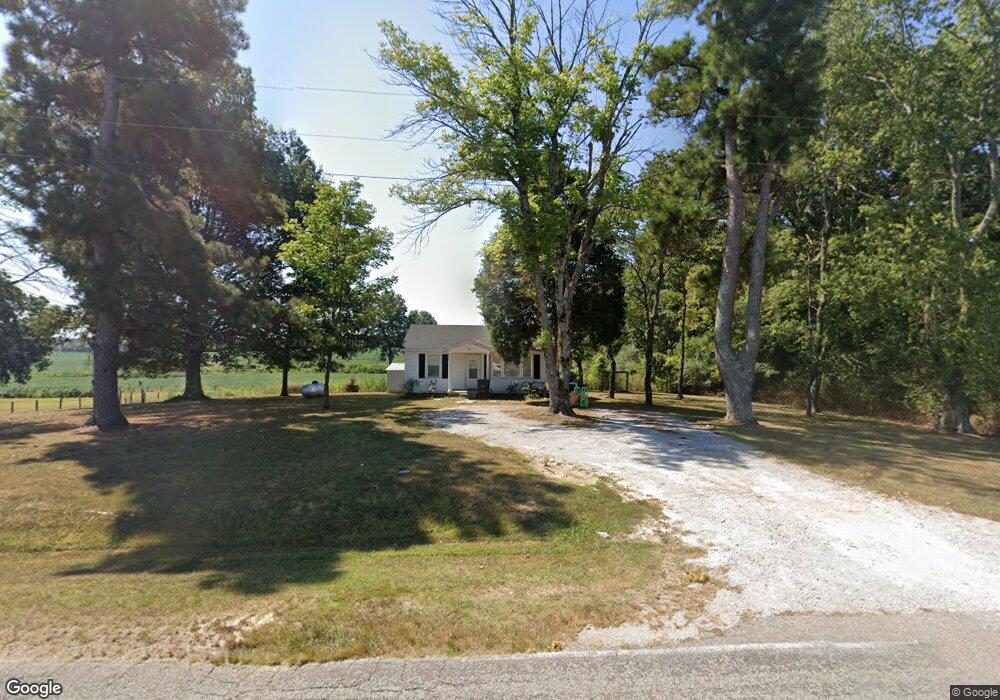
2632 Mason Grove Rd Humboldt, TN 38343
Estimated Value: $67,000 - $171,000
--
Bed
1
Bath
888
Sq Ft
$126/Sq Ft
Est. Value
About This Home
This home is located at 2632 Mason Grove Rd, Humboldt, TN 38343 and is currently estimated at $111,633, approximately $125 per square foot. 2632 Mason Grove Rd is a home located in Crockett County with nearby schools including Crockett County High School.
Ownership History
Date
Name
Owned For
Owner Type
Purchase Details
Closed on
Feb 26, 2025
Sold by
Matthews Troy A
Bought by
Troy Allen Matthews Trust and Matthews
Current Estimated Value
Purchase Details
Closed on
Jun 26, 2015
Sold by
Campbell David S
Bought by
Matthews Troy A
Purchase Details
Closed on
May 3, 2011
Sold by
Ramsey Elashia
Bought by
Campbell David S and Campbell Anne
Purchase Details
Closed on
May 9, 2005
Bought by
Ramsey Elashia
Purchase Details
Closed on
Oct 19, 2004
Sold by
Yoes Helen P
Bought by
Lambert Bobby J
Purchase Details
Closed on
Oct 18, 2004
Sold by
Lambert Bobby J
Bought by
Mccollum Pamela J
Purchase Details
Closed on
Apr 28, 1962
Bought by
Yoes Edwin and Yoes Helen
Create a Home Valuation Report for This Property
The Home Valuation Report is an in-depth analysis detailing your home's value as well as a comparison with similar homes in the area
Home Values in the Area
Average Home Value in this Area
Purchase History
| Date | Buyer | Sale Price | Title Company |
|---|---|---|---|
| Troy Allen Matthews Trust | -- | None Listed On Document | |
| Troy Allen Matthews Trust | -- | None Listed On Document | |
| Matthews Troy A | $30,700 | -- | |
| Campbell David S | $25,000 | -- | |
| Ramsey Elashia | $25,800 | -- | |
| Lambert Bobby J | $4,000 | -- | |
| Mccollum Pamela J | $4,000 | -- | |
| Yoes Edwin | -- | -- |
Source: Public Records
Tax History Compared to Growth
Tax History
| Year | Tax Paid | Tax Assessment Tax Assessment Total Assessment is a certain percentage of the fair market value that is determined by local assessors to be the total taxable value of land and additions on the property. | Land | Improvement |
|---|---|---|---|---|
| 2025 | $323 | $21,600 | $0 | $0 |
| 2024 | $323 | $14,250 | $3,825 | $10,425 |
| 2023 | $317 | $14,250 | $3,825 | $10,425 |
| 2022 | $323 | $14,250 | $3,825 | $10,425 |
| 2021 | $213 | $8,075 | $2,625 | $5,450 |
| 2020 | $209 | $8,075 | $2,625 | $5,450 |
| 2019 | $203 | $7,700 | $2,625 | $5,075 |
| 2018 | $203 | $7,700 | $2,625 | $5,075 |
| 2017 | $220 | $7,700 | $2,625 | $5,075 |
| 2016 | $220 | $8,325 | $3,250 | $5,075 |
| 2015 | $194 | $8,325 | $3,250 | $5,075 |
| 2014 | $194 | $7,337 | $0 | $0 |
Source: Public Records
Map
Nearby Homes
- 120 Westwood Cove
- 24 Walter Helms Rd
- 0 Clarence Norfleet Rd
- 136 Mason Grove Rd
- 21679 U S 79
- 133 Mason St
- 127 Franklin St
- 00 Lot#1 Humboldt Lake Rd
- 00 Lot#4 Humboldt Lake Rd
- 1313 Old Bells Rd
- 133 Westhaven Place
- 13 Acadia Cove
- 73 Westhaven Place
- 78 Larkhaven Loop
- 63 Westcott Cove
- 114 Old Stage Rd
- 118 Northhaven Dr
- 23 Forked Oak Ln
- 30 Bentbrook Cove
- 50 Cheddleton Cove
- 2730 Mason Grove Rd
- 2730 Mason Grove Rd
- 2546 Mason Grove Rd
- 2762 Mason Grove Rd
- 2512 Mason Grove Rd
- 2512 Mason Grove Rd
- 2517 Mason Grove Rd
- 2445 Mason Grove Rd
- 2377 Mason Grove Rd
- 2793 Mason Grove Rd
- 2374 Mason Grove Rd
- 2993 Mason Grove Rd
- 13 Jr Jones Rd
- 18 Jr Jones Rd
- 18 Junior Jones Rd
- 148 Junior Jones Rd
- 251 Jr Jones Rd
- 38 Junior Jones Rd
- 2238 Mason Grove Rd
- 2226 Mason Grove Rd