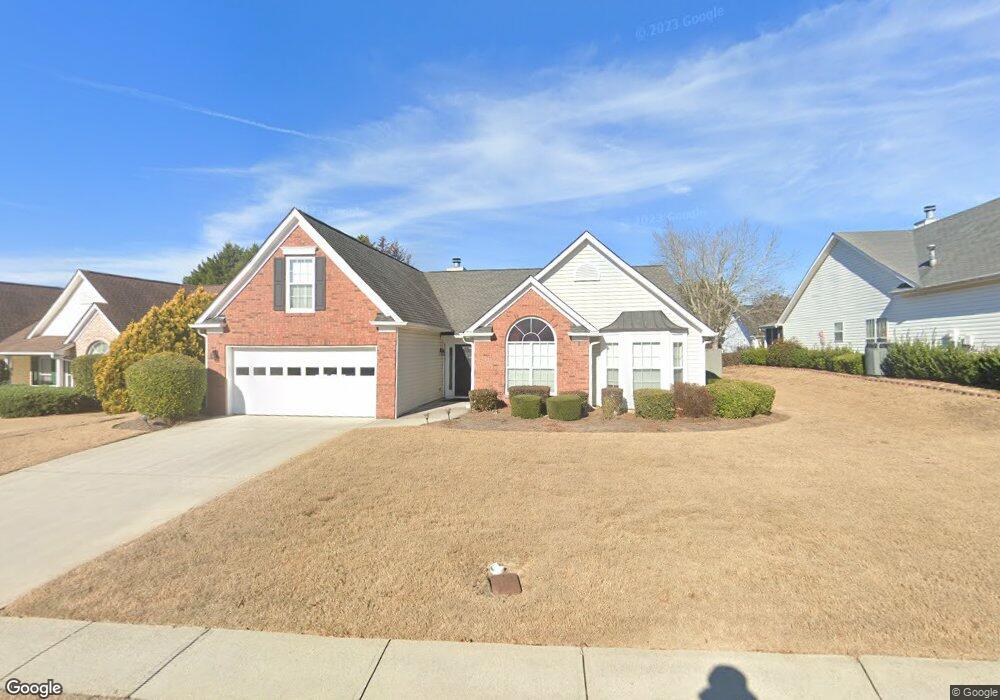
2632 Midler Ct Unit 3 Buford, GA 30519
Estimated Value: $409,000 - $448,000
4
Beds
2
Baths
2,570
Sq Ft
$166/Sq Ft
Est. Value
About This Home
This home is located at 2632 Midler Ct Unit 3, Buford, GA 30519 and is currently estimated at $427,015, approximately $166 per square foot. 2632 Midler Ct Unit 3 is a home located in Gwinnett County with nearby schools including Freeman's Mill Elementary School, Twin Rivers Middle School, and Mountain View High School.
Ownership History
Date
Name
Owned For
Owner Type
Purchase Details
Closed on
Nov 21, 2023
Sold by
Mangum Julie
Bought by
Mangum Julie B and Mangum Julie Bell
Current Estimated Value
Purchase Details
Closed on
Apr 22, 2008
Sold by
Mangum Julie
Bought by
Mangum Matthew D and Mangum Michael J
Purchase Details
Closed on
Apr 7, 2003
Sold by
Fannie Mae
Bought by
Mangum Julie B
Home Financials for this Owner
Home Financials are based on the most recent Mortgage that was taken out on this home.
Original Mortgage
$112,000
Interest Rate
5.79%
Mortgage Type
New Conventional
Purchase Details
Closed on
Oct 1, 2002
Sold by
Allen Larry K
Bought by
Federal Nat'L Mtg Assn
Purchase Details
Closed on
Oct 30, 1998
Sold by
West Palm Assoc Lp
Bought by
Allen Larry K
Home Financials for this Owner
Home Financials are based on the most recent Mortgage that was taken out on this home.
Original Mortgage
$140,650
Interest Rate
6.65%
Mortgage Type
New Conventional
Create a Home Valuation Report for This Property
The Home Valuation Report is an in-depth analysis detailing your home's value as well as a comparison with similar homes in the area
Home Values in the Area
Average Home Value in this Area
Purchase History
| Date | Buyer | Sale Price | Title Company |
|---|---|---|---|
| Mangum Julie B | -- | -- | |
| Mangum Matthew D | -- | -- | |
| Mangum Julie B | -- | -- | |
| Federal Nat'L Mtg Assn | $149,000 | -- | |
| Allen Larry K | $148,400 | -- |
Source: Public Records
Mortgage History
| Date | Status | Borrower | Loan Amount |
|---|---|---|---|
| Previous Owner | Mangum Julie B | $112,000 | |
| Previous Owner | Allen Larry K | $140,650 |
Source: Public Records
Tax History Compared to Growth
Tax History
| Year | Tax Paid | Tax Assessment Tax Assessment Total Assessment is a certain percentage of the fair market value that is determined by local assessors to be the total taxable value of land and additions on the property. | Land | Improvement |
|---|---|---|---|---|
| 2025 | $1,114 | $176,960 | $23,920 | $153,040 |
| 2024 | $1,116 | $176,600 | $30,800 | $145,800 |
| 2023 | $1,116 | $162,040 | $30,800 | $131,240 |
| 2022 | $1,077 | $128,720 | $24,000 | $104,720 |
| 2021 | $1,063 | $101,920 | $16,400 | $85,520 |
| 2020 | $1,061 | $101,920 | $16,400 | $85,520 |
| 2019 | $984 | $97,320 | $16,400 | $80,920 |
| 2018 | $966 | $93,160 | $14,000 | $79,160 |
| 2016 | $1,005 | $83,800 | $14,000 | $69,800 |
| 2015 | $1,011 | $59,840 | $10,000 | $49,840 |
| 2014 | $1,019 | $59,840 | $10,000 | $49,840 |
Source: Public Records
Map
Nearby Homes
- 2233 Hansford Pass
- 2256 Hansford Pass
- 2253 Hansford Pass
- 2228 Lakeview Bend Way
- 2299 Misty Ivy Ct
- 2375 Matlin Way
- 2500 Morgan Chase Dr
- 2729 Morgan Glen Rd
- 2045 Amber Creek Dr
- 2508 Morgan Chase Dr
- 2970 Waverly Place Dr
- 3009 Morgan Spring Trail
- 3049 Morgan Spring Trail
- 2585 Braselton Hwy
- 0 Hog Mountain Church Road and Auburn Rd
- 2340 Cain Cir
- 2402 Bancroft Way
- 2655 Camp Branch Rd
- 2642 Midler Ct
- 2612 Midler Ct
- 2675 Matlin Way Unit 1
- 2665 Matlin Way
- 2652 Midler Ct
- 2685 Matlin Way Unit 1
- 2627 Midler Ct
- 2655 Matlin Way Unit 1
- 2637 Midler Ct
- 2695 Matlin Way
- 2617 Midler Ct
- 2645 Matlin Way Unit 1
- 2662 Midler Ct
- 226 Hansford Pass
- 2657 Midler Ct
- 2592 Midler Ct Unit 3
- 2607 Midler Ct Unit 3
- 2597 Midler Ct
- 2670 Matlin Way
- 2624 Honors Ct Unit 3