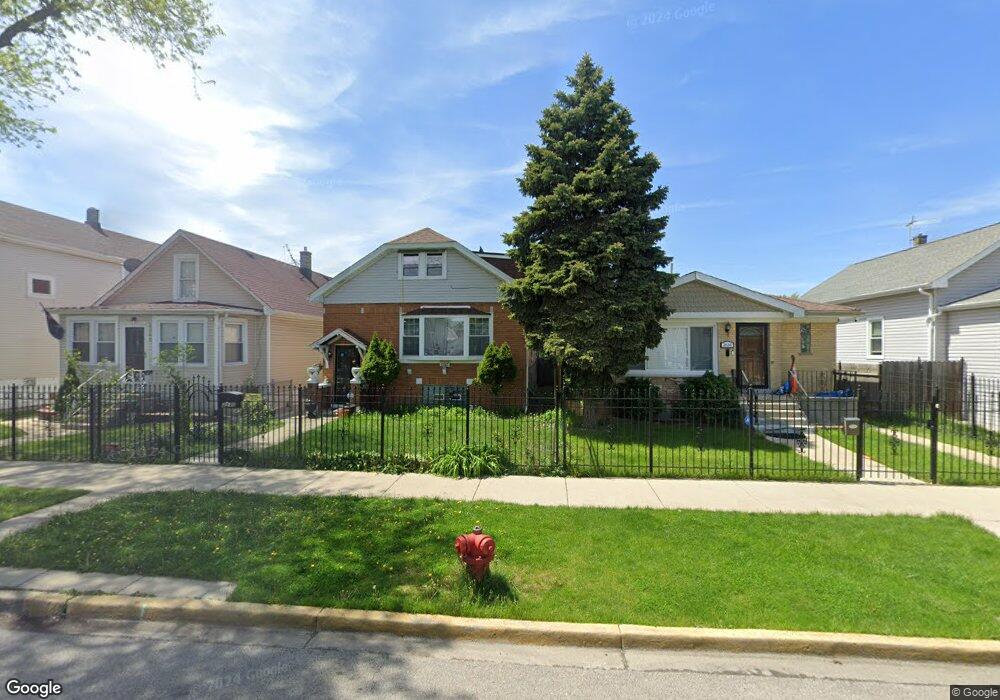
2632 N Mason Ave Chicago, IL 60639
Belmont Central NeighborhoodEstimated Value: $398,937 - $458,000
4
Beds
2
Baths
1,824
Sq Ft
$228/Sq Ft
Est. Value
About This Home
This home is located at 2632 N Mason Ave, Chicago, IL 60639 and is currently estimated at $416,734, approximately $228 per square foot. 2632 N Mason Ave is a home located in Cook County with nearby schools including Lyon Elementary School, Steinmetz College Prep, and Horizon Science Academy-Belmont.
Ownership History
Date
Name
Owned For
Owner Type
Purchase Details
Closed on
May 30, 2006
Sold by
Montiel Socrates and Montiel Estela
Bought by
Nieves Maria D
Current Estimated Value
Home Financials for this Owner
Home Financials are based on the most recent Mortgage that was taken out on this home.
Original Mortgage
$280,000
Outstanding Balance
$168,545
Interest Rate
7%
Mortgage Type
New Conventional
Estimated Equity
$248,189
Purchase Details
Closed on
Jan 23, 2003
Sold by
Casillas Nimio and Casillas Carmen
Bought by
Montiel Socrates and Montiel Estela
Home Financials for this Owner
Home Financials are based on the most recent Mortgage that was taken out on this home.
Original Mortgage
$250,800
Interest Rate
6.06%
Mortgage Type
Purchase Money Mortgage
Purchase Details
Closed on
Nov 27, 1996
Sold by
Kirnbauer Alfred A and Kirnbauer Lucille V
Bought by
Casillas Mimio and Casillas Carmen
Home Financials for this Owner
Home Financials are based on the most recent Mortgage that was taken out on this home.
Original Mortgage
$119,785
Interest Rate
8.05%
Mortgage Type
FHA
Create a Home Valuation Report for This Property
The Home Valuation Report is an in-depth analysis detailing your home's value as well as a comparison with similar homes in the area
Home Values in the Area
Average Home Value in this Area
Purchase History
| Date | Buyer | Sale Price | Title Company |
|---|---|---|---|
| Nieves Maria D | $350,000 | Heritage Title Company | |
| Montiel Socrates | $264,000 | Pntn | |
| Casillas Mimio | $120,000 | Attorneys Natl Title Network |
Source: Public Records
Mortgage History
| Date | Status | Borrower | Loan Amount |
|---|---|---|---|
| Open | Nieves Maria D | $280,000 | |
| Previous Owner | Montiel Socrates | $250,800 | |
| Previous Owner | Casillas Mimio | $119,785 |
Source: Public Records
Tax History Compared to Growth
Tax History
| Year | Tax Paid | Tax Assessment Tax Assessment Total Assessment is a certain percentage of the fair market value that is determined by local assessors to be the total taxable value of land and additions on the property. | Land | Improvement |
|---|---|---|---|---|
| 2024 | $4,578 | $31,629 | $7,570 | $24,059 |
| 2023 | $4,441 | $25,000 | $6,138 | $18,862 |
| 2022 | $4,441 | $25,000 | $6,138 | $18,862 |
| 2021 | $4,360 | $25,000 | $6,138 | $18,862 |
| 2020 | $4,171 | $21,815 | $4,501 | $17,314 |
| 2019 | $4,238 | $24,512 | $4,501 | $20,011 |
| 2018 | $4,166 | $24,512 | $4,501 | $20,011 |
| 2017 | $5,096 | $27,037 | $4,092 | $22,945 |
| 2016 | $4,918 | $27,037 | $4,092 | $22,945 |
| 2015 | $4,476 | $27,037 | $4,092 | $22,945 |
| 2014 | $4,234 | $25,371 | $3,682 | $21,689 |
| 2013 | $4,281 | $26,153 | $3,682 | $22,471 |
Source: Public Records
Map
Nearby Homes
- 2630 N Austin Ave
- 2536 N Austin Ave
- 2744 N Marmora Ave
- 2601 N Moody Ave
- 5836 W Diversey Ave
- 2612 N Moody Ave
- 2714 N Mango Ave
- 2728 N Mango Ave
- 2735 N Mango Ave
- 2852 N Meade Ave
- 2531 N Major Ave
- 2448 N Major Ave
- 2841 N Melvina Ave
- 2730 N Merrimac Ave
- 2951 N Austin Ave
- 2851 N Major Ave
- 2724 N Mobile Ave
- 2314 N Mango Ave
- 2341 N Major Ave
- 2430 N Central Ave
- 2628 N Mason Ave
- 2634 N Mason Ave
- 2624 N Mason Ave
- 2638 N Mason Ave
- 2622 N Mason Ave
- 2640 N Mason Ave
- 2644 N Mason Ave
- 2629 N Austin Ave
- 2635 N Austin Ave
- 2633 N Austin Ave
- 2625 N Austin Ave
- 2639 N Austin Ave
- 2616 N Mason Ave
- 2648 N Mason Ave
- 2621 N Austin Ave
- 2637 N Mason Ave
- 2633 N Mason Ave
- 2635 N Mason Ave
- 2629 N Mason Ave
- 2645 N Austin Ave