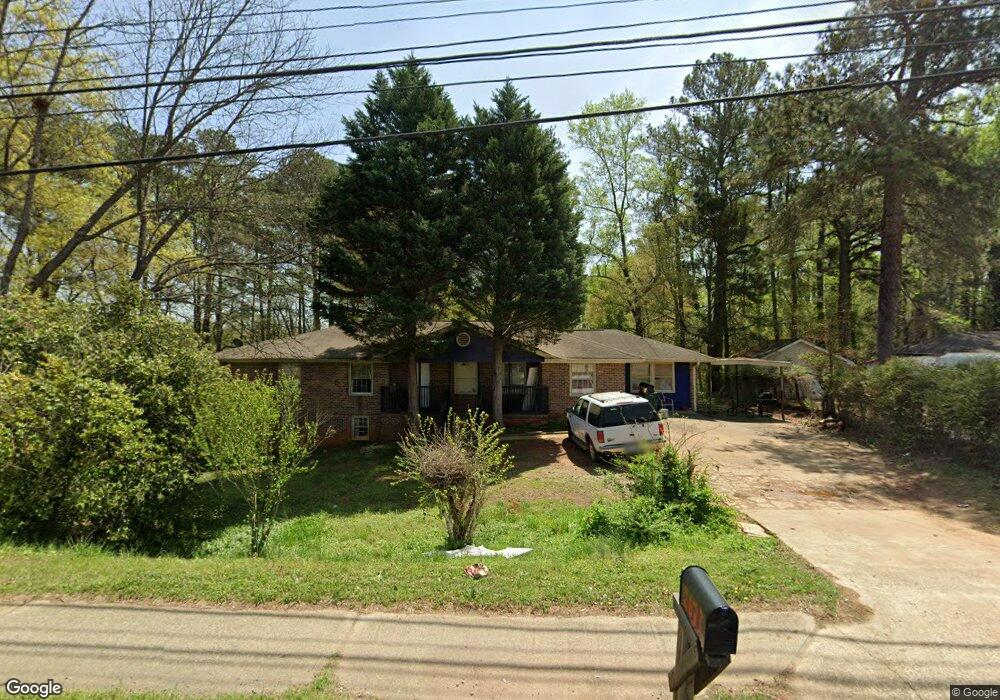
2633 Austell Rd SW Marietta, GA 30008
Southwestern Marietta NeighborhoodEstimated Value: $282,000 - $361,000
3
Beds
3
Baths
1,868
Sq Ft
$178/Sq Ft
Est. Value
About This Home
This home is located at 2633 Austell Rd SW, Marietta, GA 30008 and is currently estimated at $331,866, approximately $177 per square foot. 2633 Austell Rd SW is a home located in Cobb County with nearby schools including Birney Elementary School, Floyd Middle School, and Osborne High School.
Ownership History
Date
Name
Owned For
Owner Type
Purchase Details
Closed on
Mar 18, 2008
Sold by
Amaya Jose F and Amaya Lorena V
Bought by
Martinez Solomon
Current Estimated Value
Purchase Details
Closed on
Mar 31, 2004
Sold by
Amaya Lorena V
Bought by
Amaya Lorena V and Amaya Jose
Home Financials for this Owner
Home Financials are based on the most recent Mortgage that was taken out on this home.
Original Mortgage
$125,300
Interest Rate
5.55%
Mortgage Type
New Conventional
Purchase Details
Closed on
Jun 3, 2003
Sold by
Thomas Fred
Bought by
Chase Manhattan Mortgage Corp
Purchase Details
Closed on
May 16, 2002
Sold by
Mctyre Doyle C
Bought by
Thomas Fred
Home Financials for this Owner
Home Financials are based on the most recent Mortgage that was taken out on this home.
Original Mortgage
$161,950
Interest Rate
6.92%
Mortgage Type
New Conventional
Create a Home Valuation Report for This Property
The Home Valuation Report is an in-depth analysis detailing your home's value as well as a comparison with similar homes in the area
Home Values in the Area
Average Home Value in this Area
Purchase History
| Date | Buyer | Sale Price | Title Company |
|---|---|---|---|
| Martinez Solomon | $117,700 | -- | |
| Amaya Lorena V | -- | -- | |
| Amaya Lorena V | -- | -- | |
| Chase Manhattan Mortgage Corp | $105,414 | -- | |
| Thomas Fred | $167,000 | -- |
Source: Public Records
Mortgage History
| Date | Status | Borrower | Loan Amount |
|---|---|---|---|
| Previous Owner | Amaya Lorena V | $125,300 | |
| Previous Owner | Thomas Fred | $161,950 |
Source: Public Records
Tax History Compared to Growth
Tax History
| Year | Tax Paid | Tax Assessment Tax Assessment Total Assessment is a certain percentage of the fair market value that is determined by local assessors to be the total taxable value of land and additions on the property. | Land | Improvement |
|---|---|---|---|---|
| 2025 | $1,485 | $49,288 | $37,920 | $11,368 |
| 2024 | $3,095 | $102,664 | $37,920 | $64,744 |
| 2023 | $2,818 | $93,476 | $34,128 | $59,348 |
| 2022 | $2,568 | $84,628 | $25,280 | $59,348 |
| 2021 | $2,088 | $68,800 | $22,752 | $46,048 |
| 2020 | $1,858 | $61,216 | $15,168 | $46,048 |
| 2019 | $1,858 | $61,216 | $15,168 | $46,048 |
| 2018 | $1,572 | $51,784 | $8,848 | $42,936 |
| 2017 | $1,489 | $51,784 | $8,848 | $42,936 |
| 2016 | $1,391 | $48,372 | $7,584 | $40,788 |
| 2015 | $1,448 | $49,140 | $8,848 | $40,292 |
| 2014 | $1,460 | $49,140 | $0 | $0 |
Source: Public Records
Map
Nearby Homes
- 881 Whittington Pkwy
- 1105 Woodleigh Rd SW
- 2760 Hicks Rd SW
- 2907 Crest Ridge Ct SW
- 1197 Woodleigh Rd SW
- 1104 Havel Dr SW
- 2940 Caller Ct SW
- 1086 Mornington Way
- 1020 Hicksmil Dr SW
- 1345 Windage Ct SW Unit 6
- 2615 Windage Dr SW
- 1308 Willamette Way
- 2964 Edgemont Ln SW
- 959 Old Milford Church Rd SW
- 3004 Michael Dr SW
- 825 Winfield Ct SW
- 641 Favorwood Dr SW
- 2653 Austell Rd SW
- 2635 Austell Rd SW
- 2672 Austell Rd SW
- 2637 Austell Rd SW
- 2644 Austell Rd SW
- 2674 Austell Rd SW
- 1140 Cliff Crest Ct SW
- 1150 Cliff Crest Ct SW
- 2667 Austell Rd SW
- 1130 Cliff Crest Ct SW
- 2610 Austell Rd SW
- 2695 Austell Rd SW
- 1003 Britt Dr SW
- 1139 Cliff Crest Ct SW
- 2616 Austell Rd SW
- 2612 Austell Rd SW
- 865 Whittington Pkwy
- 865 Whittington Pkwy Unit 28
- 997 Britt Dr SW
- 877 Whittington Pkwy Unit 31