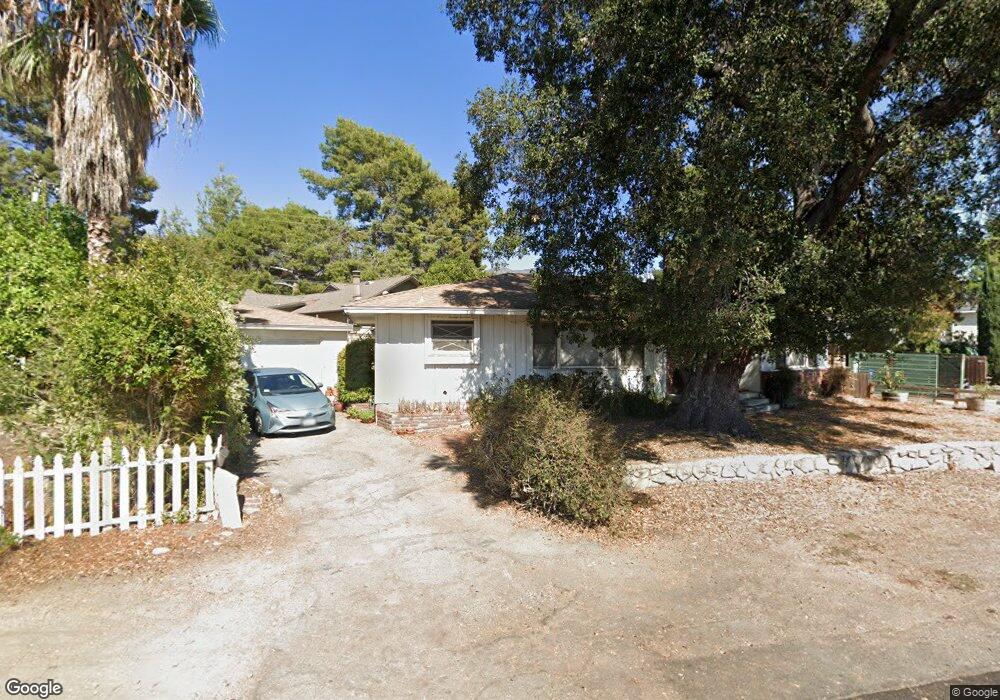
2633 Mayfield Ave La Crescenta, CA 91214
Estimated Value: $1,069,000 - $1,410,000
2
Beds
2
Baths
1,559
Sq Ft
$774/Sq Ft
Est. Value
About This Home
This home is located at 2633 Mayfield Ave, La Crescenta, CA 91214 and is currently estimated at $1,207,128, approximately $774 per square foot. 2633 Mayfield Ave is a home located in Los Angeles County with nearby schools including La Crescenta Elementary School, Rosemont Middle School, and Crescenta Valley High School.
Ownership History
Date
Name
Owned For
Owner Type
Purchase Details
Closed on
Aug 5, 2020
Sold by
Ecker Cheryl
Bought by
Ecker Cheryl
Current Estimated Value
Home Financials for this Owner
Home Financials are based on the most recent Mortgage that was taken out on this home.
Original Mortgage
$395,000
Outstanding Balance
$351,040
Interest Rate
3.1%
Mortgage Type
New Conventional
Estimated Equity
$856,088
Purchase Details
Closed on
Aug 24, 2017
Sold by
Ecker Christopher John
Bought by
Ecker Cheryl
Home Financials for this Owner
Home Financials are based on the most recent Mortgage that was taken out on this home.
Original Mortgage
$390,000
Interest Rate
3.96%
Mortgage Type
New Conventional
Purchase Details
Closed on
May 13, 1997
Sold by
Hall Jeffrey R and Hall Betsy A
Bought by
Ecker Christopher John and Ecker Chery
Home Financials for this Owner
Home Financials are based on the most recent Mortgage that was taken out on this home.
Original Mortgage
$146,400
Interest Rate
7.98%
Create a Home Valuation Report for This Property
The Home Valuation Report is an in-depth analysis detailing your home's value as well as a comparison with similar homes in the area
Home Values in the Area
Average Home Value in this Area
Purchase History
| Date | Buyer | Sale Price | Title Company |
|---|---|---|---|
| Ecker Cheryl | -- | Fidelity National Title | |
| Ecker Cheryl | -- | Fidelity National Title | |
| Ecker Christopher John | $183,000 | Commonwealth Title |
Source: Public Records
Mortgage History
| Date | Status | Borrower | Loan Amount |
|---|---|---|---|
| Open | Ecker Cheryl | $395,000 | |
| Closed | Ecker Cheryl | $390,000 | |
| Closed | Ecker Christopher John | $146,400 |
Source: Public Records
Tax History
| Year | Tax Paid | Tax Assessment Tax Assessment Total Assessment is a certain percentage of the fair market value that is determined by local assessors to be the total taxable value of land and additions on the property. | Land | Improvement |
|---|---|---|---|---|
| 2025 | $3,633 | $298,026 | $159,599 | $138,427 |
| 2024 | $3,633 | $292,183 | $156,470 | $135,713 |
| 2023 | $3,557 | $286,454 | $153,402 | $133,052 |
| 2022 | $3,301 | $280,839 | $150,395 | $130,444 |
| 2021 | $3,238 | $275,334 | $147,447 | $127,887 |
| 2019 | $3,116 | $267,170 | $143,075 | $124,095 |
| 2018 | $3,013 | $261,932 | $140,270 | $121,662 |
| 2016 | $2,859 | $251,763 | $134,824 | $116,939 |
| 2015 | $2,793 | $247,982 | $132,799 | $115,183 |
| 2014 | $2,776 | $243,125 | $130,198 | $112,927 |
Source: Public Records
Map
Nearby Homes
- 2434 Prospect Ave
- 2806 Manhattan Ave
- 2727 Altura Ave
- 2817 Montrose Ave
- 2700 Prospect Ave
- 2900 Fairway Ave Unit 507
- 2905 Montrose Ave Unit 610
- 2345 Caldero Ln
- 2442 Cross St
- 2608 Honolulu Ave Unit 310
- 2944 Mayfield Ave
- 3010 Montrose Ave Unit 33
- 3055 Sycamore Ave
- 4123 Ocean View Blvd
- 21 Northwoods Ln
- 1255 Oak Circle Dr
- 4731 Briggs Ave
- 2217 Crescent Ave
- 3130 Montrose Ave Unit 102
- 4608 La Crescenta Ave
- 2631 Mayfield Ave
- 2623 Mayfield Ave
- 2637 Mayfield Ave
- 2634 Mayfield Ave
- 2638 Mayfield Ave
- 2639 Mayfield Ave
- 2617 Mayfield Ave
- 2628 Mayfield Ave
- 2644 Mayfield Ave
- 2624 Mayfield Ave
- 2648 Mayfield Ave
- 2615 Mayfield Ave
- 2653 Fairway Ave
- 2647 Fairway Ave
- 2657 Fairway Ave
- 2618 Mayfield Ave
- 2643 Mayfield Ave
- 2654 Mayfield Ave
- 2609 Mayfield Ave
- 2643 Fairway Ave
Your Personal Tour Guide
Ask me questions while you tour the home.