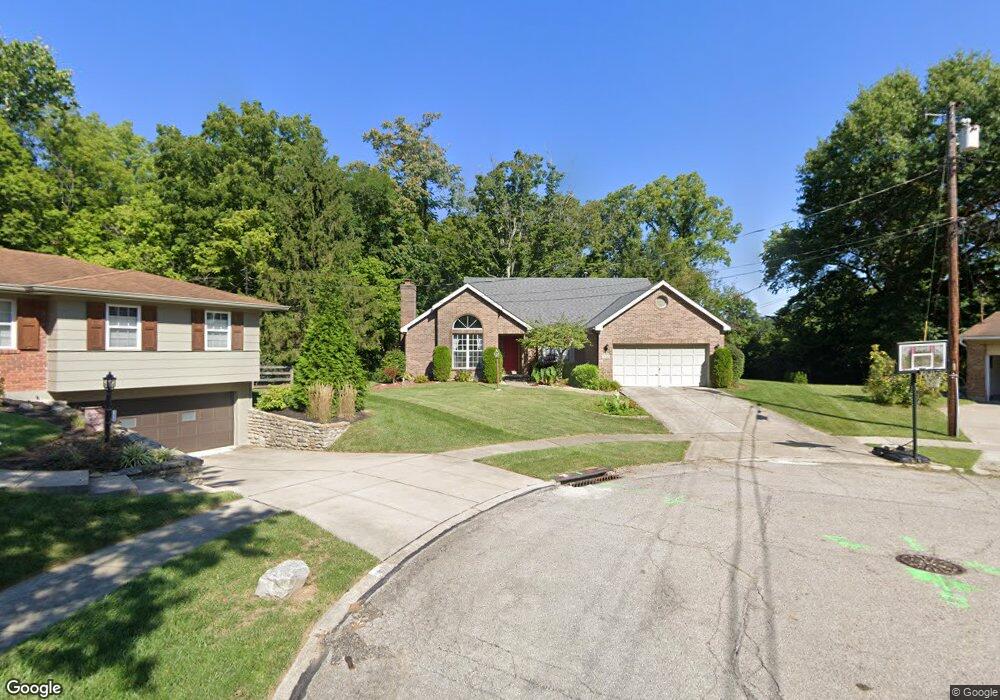
2633 Meadowmar Ln Cincinnati, OH 45230
Mount Washington NeighborhoodEstimated Value: $332,000 - $368,879
2
Beds
2
Baths
1,641
Sq Ft
$212/Sq Ft
Est. Value
About This Home
This home is located at 2633 Meadowmar Ln, Cincinnati, OH 45230 and is currently estimated at $347,220, approximately $211 per square foot. 2633 Meadowmar Ln is a home located in Hamilton County with nearby schools including Mt. Washington Elementary School, Clark Montessori High School, and Shroder High School.
Ownership History
Date
Name
Owned For
Owner Type
Purchase Details
Closed on
Feb 3, 2021
Sold by
Lopez Ricardo and Lopez Trina
Bought by
Lopez Ricardo and Lopez Trina
Current Estimated Value
Home Financials for this Owner
Home Financials are based on the most recent Mortgage that was taken out on this home.
Original Mortgage
$205,000
Outstanding Balance
$150,905
Interest Rate
2.7%
Mortgage Type
Future Advance Clause Open End Mortgage
Estimated Equity
$196,315
Purchase Details
Closed on
Jul 13, 2006
Sold by
Negussu Bethlehem
Bought by
Lopez Ricardo
Home Financials for this Owner
Home Financials are based on the most recent Mortgage that was taken out on this home.
Original Mortgage
$178,600
Interest Rate
6.82%
Mortgage Type
Unknown
Purchase Details
Closed on
Nov 25, 2002
Sold by
Lawson Amos M and Lawson Bertha Lee
Bought by
Negussu Bethlehem
Purchase Details
Closed on
Sep 30, 2002
Sold by
Bartlett Marilyn L and Bartlett Walter E
Bought by
Lawson Amos M and Lawson Bertha Lee
Create a Home Valuation Report for This Property
The Home Valuation Report is an in-depth analysis detailing your home's value as well as a comparison with similar homes in the area
Home Values in the Area
Average Home Value in this Area
Purchase History
| Date | Buyer | Sale Price | Title Company |
|---|---|---|---|
| Lopez Ricardo | -- | None Available | |
| Lopez Ricardo | $100,000 | Vintage Title Agency Inc | |
| Negussu Bethlehem | $159,900 | -- | |
| Lawson Amos M | $135,000 | -- |
Source: Public Records
Mortgage History
| Date | Status | Borrower | Loan Amount |
|---|---|---|---|
| Open | Lopez Ricardo | $205,000 | |
| Closed | Lopez Ricardo | $178,600 |
Source: Public Records
Tax History Compared to Growth
Tax History
| Year | Tax Paid | Tax Assessment Tax Assessment Total Assessment is a certain percentage of the fair market value that is determined by local assessors to be the total taxable value of land and additions on the property. | Land | Improvement |
|---|---|---|---|---|
| 2024 | $6,221 | $104,188 | $10,780 | $93,408 |
| 2023 | $6,362 | $104,188 | $10,780 | $93,408 |
| 2022 | $5,727 | $84,123 | $8,778 | $75,345 |
| 2021 | $5,512 | $84,123 | $8,778 | $75,345 |
| 2020 | $5,674 | $84,123 | $8,778 | $75,345 |
| 2019 | $5,441 | $73,791 | $7,700 | $66,091 |
| 2018 | $5,449 | $73,791 | $7,700 | $66,091 |
| 2017 | $5,176 | $73,791 | $7,700 | $66,091 |
| 2016 | $4,608 | $64,750 | $7,700 | $57,050 |
| 2015 | $4,154 | $64,750 | $7,700 | $57,050 |
| 2014 | $4,184 | $64,750 | $7,700 | $57,050 |
| 2013 | $4,256 | $64,750 | $7,700 | $57,050 |
Source: Public Records
Map
Nearby Homes
- 2560 Coveyrun Ct
- 2454 Doeview Ct
- 2456 Doeview Ct
- 5459 Hanover Cir
- 6426 Silverfox Dr
- 5463 Hanover Cir
- 2447 Coveyrun S
- 2475 Walnutview Ct
- 2536 Ranchvale Dr
- 6189 Wasigo Dr
- 2453 Sanctuary Cir
- 6436 Wildhaven Way
- 6530 Silverfox Dr
- 6279 Crestview Place
- 6519 Rainbow Ln
- 2455 Rainbow Ct
- 6196 Turpin Hills Dr
- 5308 Reserve Cir
- 2121 Sutton Ave
- 2627 Meadowmar Ln
- 2632 Meadowmar Ln
- 2665 Beechmar Dr
- 2657 Beechmar Dr
- 2620 Meadowmar Ln
- 2615 Meadowmar Ln
- 2636 Beechmar Dr
- 2614 Meadowmar Ln
- 6355 Copperleaf Ln
- 6365 Copperleaf Ln
- 2670 Beechmar Dr
- 2660 Beechmar Dr
- 2608 Meadowmar Ln
- 2645 Beechmar Dr
- 2602 Meadowmar Ln
- 2650 Beechmar Dr
- 2593 Meadowmar Ln
- 2639 Beechmar Dr
- 2600 Meadowmar Ln
- 2646 Beechmar Dr