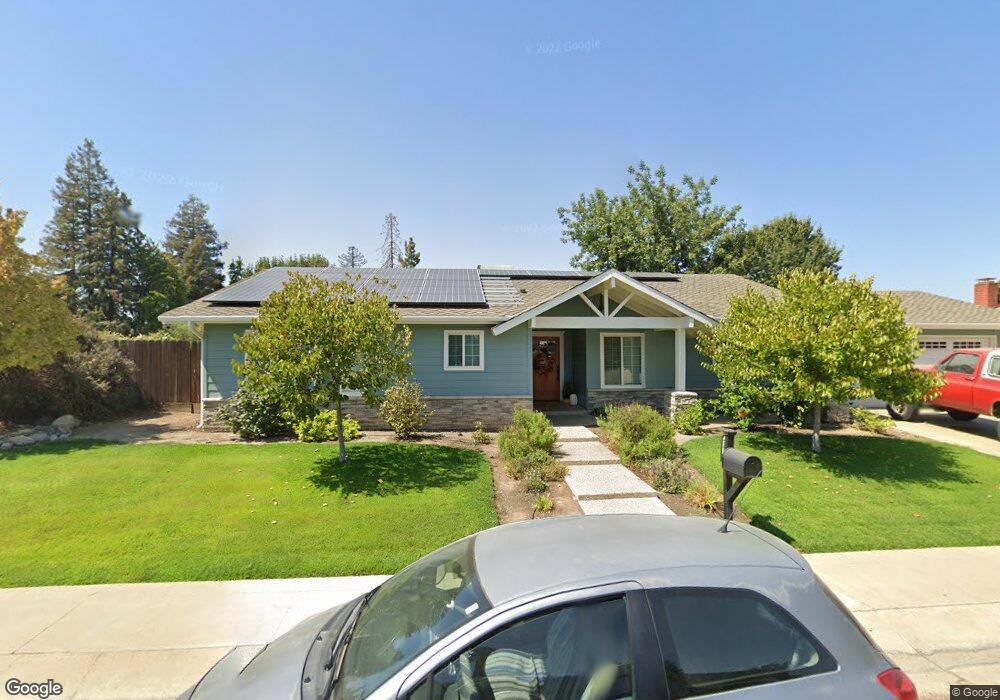
2633 S Silvervale St Visalia, CA 93277
Northwest Visalia NeighborhoodEstimated Value: $924,000 - $988,000
4
Beds
4
Baths
3,638
Sq Ft
$262/Sq Ft
Est. Value
About This Home
This home is located at 2633 S Silvervale St, Visalia, CA 93277 and is currently estimated at $953,808, approximately $262 per square foot. 2633 S Silvervale St is a home located in Tulare County with nearby schools including Manuel F. Hernandez, Green Acres Middle School, and Redwood High School.
Ownership History
Date
Name
Owned For
Owner Type
Purchase Details
Closed on
Dec 30, 2024
Sold by
Malagon Esperanza
Bought by
Huerta Khristopher R and Huerta Jennifer L
Current Estimated Value
Home Financials for this Owner
Home Financials are based on the most recent Mortgage that was taken out on this home.
Original Mortgage
$662,000
Outstanding Balance
$655,514
Interest Rate
6.72%
Mortgage Type
New Conventional
Estimated Equity
$298,294
Purchase Details
Closed on
Nov 9, 2021
Sold by
D R Horton Ca3 Inc
Bought by
Vander Weerd Investments
Purchase Details
Closed on
Feb 19, 2021
Sold by
D R Horton Ca3 Inc
Bought by
Malagon Jaime Argueta and Malagon Esperanza
Home Financials for this Owner
Home Financials are based on the most recent Mortgage that was taken out on this home.
Original Mortgage
$514,900
Interest Rate
2.7%
Mortgage Type
VA
Purchase Details
Closed on
Jan 15, 2021
Sold by
D R Horton Ca3 Inc
Bought by
Malagon Jaime Argueta and Malagon Esperanza
Home Financials for this Owner
Home Financials are based on the most recent Mortgage that was taken out on this home.
Original Mortgage
$514,900
Interest Rate
2.7%
Mortgage Type
VA
Purchase Details
Closed on
Jul 2, 2018
Sold by
Vander Weerd Investments
Bought by
D R Horton Ca3 Inc
Create a Home Valuation Report for This Property
The Home Valuation Report is an in-depth analysis detailing your home's value as well as a comparison with similar homes in the area
Home Values in the Area
Average Home Value in this Area
Purchase History
| Date | Buyer | Sale Price | Title Company |
|---|---|---|---|
| Huerta Khristopher R | $934,000 | Chicago Title | |
| Vander Weerd Investments | -- | First American Title Company | |
| Malagon Jaime Argueta | $715,000 | Fidelity National Title | |
| Malagon Jaime Argueta | $715,000 | Fidelity National Title Co | |
| D R Horton Ca3 Inc | $3,028,500 | First American Title Co |
Source: Public Records
Mortgage History
| Date | Status | Borrower | Loan Amount |
|---|---|---|---|
| Open | Huerta Khristopher R | $662,000 | |
| Previous Owner | Malagon Jaime Argueta | $514,900 | |
| Previous Owner | Malagon Jaime Argueta | $514,900 |
Source: Public Records
Tax History
| Year | Tax Paid | Tax Assessment Tax Assessment Total Assessment is a certain percentage of the fair market value that is determined by local assessors to be the total taxable value of land and additions on the property. | Land | Improvement |
|---|---|---|---|---|
| 2025 | $6,937 | $815,843 | $184,013 | $631,830 |
| 2024 | $6,937 | $799,847 | $180,405 | $619,442 |
| 2023 | $6,808 | $784,165 | $176,868 | $607,297 |
| 2022 | $6,597 | $768,790 | $173,400 | $595,390 |
| 2021 | $1,614 | $135,691 | $135,691 | $0 |
| 2020 | $1,611 | $47,100 | $47,100 | $0 |
| 2019 | $678 | $46,176 | $46,176 | $0 |
| 2018 | $656 | $45,271 | $45,271 | $0 |
| 2017 | $648 | $44,383 | $44,383 | $0 |
| 2016 | $642 | $43,513 | $43,513 | $0 |
| 2015 | $629 | $42,859 | $42,859 | $0 |
| 2014 | $629 | $42,019 | $42,019 | $0 |
Source: Public Records
Map
Nearby Homes
- 3243 W Sedona Ave
- 2650 N Kayenta St
- 3242 W Oakridge Ave
- 2841 W Prescott Ave
- 7930 W Sunnyview Ave
- 3615 W Sunnyview Ave
- 2648 N Vickie St
- 2316 N Carson Ct
- 2200 N University St
- 4017 W Babcock Ave
- 4030 W Babcock Ave
- 2336 N Kayenta St Unit 2028v
- 4033 W Babcock Ave
- 2312 N Kayenta St Unit 2024 V
- 4027 W Babcock Ave
- 4011 W Babcock Ave
- 3624 N Jackie St
- 3020 W Ceres Ave
- 5035 W Sunnyview Ct Unit Syc57
- 2650 W Sedona Ave
- 2649 S Silvervale St
- 2629 S Silvervale St
- 2621 S Silvervale St
- 3604 W Lark Ave
- 3620 W Lark Ave
- 3546 W Lark Ave
- 3628 W Lark Ave
- 3534 W Lark Ave
- 3601 W Lark Ave
- 3617 W Lark Ave
- 3543 W Lark Ave
- 3625 W Lark Ave
- 3638 W Lark Ave
- 3522 W Lark Ave
- 3525 W Lark Ave
- 3635 W Lark Ave
- 3650 W Lark Ave
- 3510 W Lark Ave
- 3515 W Lark Ave
- 3647 W Lark Ave
Your Personal Tour Guide
Ask me questions while you tour the home.