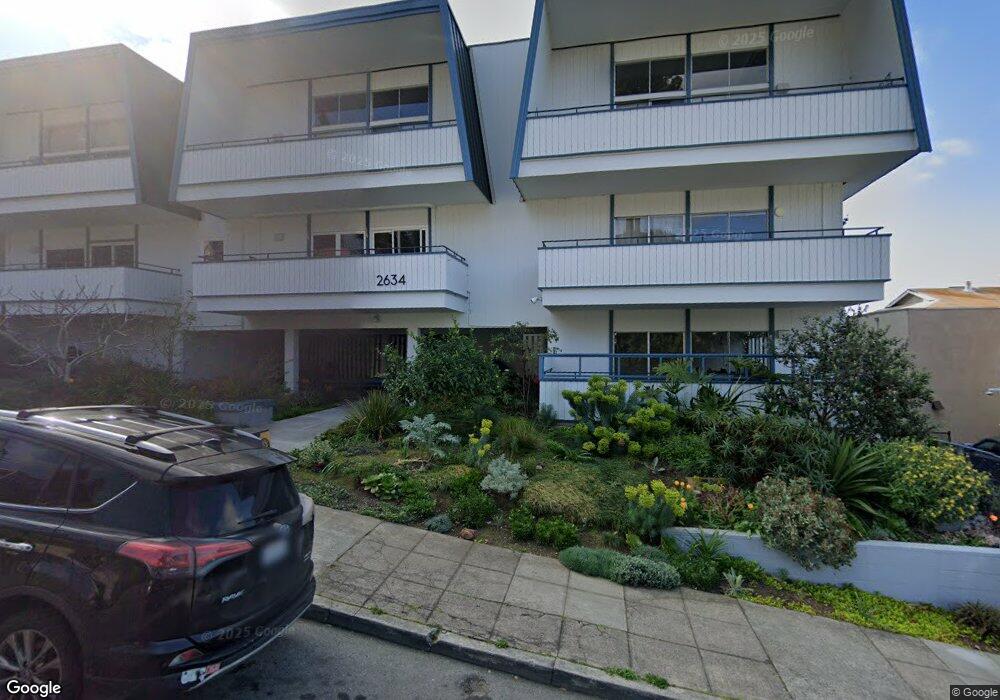
2634 Virginia St Berkeley, CA 94709
North Berkeley NeighborhoodEstimated Value: $733,000 - $770,000
1
Bed
1
Bath
872
Sq Ft
$854/Sq Ft
Est. Value
About This Home
This home is located at 2634 Virginia St, Berkeley, CA 94709 and is currently estimated at $745,048, approximately $854 per square foot. 2634 Virginia St is a home located in Alameda County with nearby schools including Berkeley Arts Magnet at Whittier School, Washington Elementary School, and Cragmont Elementary School.
Ownership History
Date
Name
Owned For
Owner Type
Purchase Details
Closed on
Feb 22, 2019
Sold by
Scott William T and Chayt Matthew A
Bought by
Liu David Kuan Yu and Liu Tsu Jae
Current Estimated Value
Purchase Details
Closed on
Oct 9, 2014
Sold by
Schwan Nelly Rojas and Schwan Hubert
Bought by
Scott William T and Chayt Matthew A
Home Financials for this Owner
Home Financials are based on the most recent Mortgage that was taken out on this home.
Original Mortgage
$417,000
Interest Rate
4.08%
Mortgage Type
New Conventional
Purchase Details
Closed on
Aug 27, 2002
Sold by
Lew Yim T and Lew Li H
Bought by
Schwan Hubert and Schwan Nelly Rojas
Home Financials for this Owner
Home Financials are based on the most recent Mortgage that was taken out on this home.
Original Mortgage
$268,400
Interest Rate
5.62%
Mortgage Type
Purchase Money Mortgage
Purchase Details
Closed on
Mar 18, 1991
Sold by
Lew Yim T and Lew Li H
Bought by
Lew Yim T and Lew Li H
Create a Home Valuation Report for This Property
The Home Valuation Report is an in-depth analysis detailing your home's value as well as a comparison with similar homes in the area
Home Values in the Area
Average Home Value in this Area
Purchase History
| Date | Buyer | Sale Price | Title Company |
|---|---|---|---|
| Liu David Kuan Yu | $750,000 | Old Republic Title Company | |
| Scott William T | $445,000 | Chicago Title Company | |
| Schwan Hubert | $335,500 | Placer Title Company | |
| Lew Yim T | -- | -- |
Source: Public Records
Mortgage History
| Date | Status | Borrower | Loan Amount |
|---|---|---|---|
| Previous Owner | Scott William T | $417,000 | |
| Previous Owner | Schwan Hubert | $268,400 |
Source: Public Records
Tax History
| Year | Tax Paid | Tax Assessment Tax Assessment Total Assessment is a certain percentage of the fair market value that is determined by local assessors to be the total taxable value of land and additions on the property. | Land | Improvement |
|---|---|---|---|---|
| 2025 | $12,352 | $836,624 | $250,987 | $585,637 |
| 2024 | $12,352 | $820,221 | $246,066 | $574,155 |
| 2023 | $12,101 | $804,141 | $241,242 | $562,899 |
| 2022 | $11,897 | $788,377 | $236,513 | $551,864 |
| 2021 | $11,934 | $772,920 | $231,876 | $541,044 |
| 2020 | $11,326 | $765,000 | $229,500 | $535,500 |
| 2019 | $7,620 | $479,433 | $143,830 | $335,603 |
| 2018 | $7,400 | $470,034 | $141,010 | $329,024 |
| 2017 | $7,132 | $460,818 | $138,245 | $322,573 |
| 2016 | $6,877 | $451,785 | $135,535 | $316,250 |
| 2015 | $6,782 | $445,000 | $133,500 | $311,500 |
| 2014 | $6,315 | $396,373 | $118,971 | $277,402 |
Source: Public Records
Map
Nearby Homes
- 2634 Virginia St Unit 13
- 2600 Hilgard Ave
- 2700 Le Conte Ave Unit 301
- 2700 Le Conte Ave Unit 402
- 2451 Le Conte Ave
- 2340 Virginia St
- 1471 Scenic Ave
- 2201 Virginia St Unit 2
- 1444 Walnut St
- 1375 Queens Rd
- 0 Queens Rd Unit ML82024219
- 209 Fairlawn Dr
- 1440 Walnut St Unit 5
- 1468 Summit Rd
- 2015 Delaware St
- 2015 Delaware St Unit A
- 0 Panoramic Way Unit 41118724
- 1610 Milvia St
- 1136 Keith Ave
- 2 Panoramic Way Unit 105
- 2634 Virginia St Unit 35
- 2634 Virginia St Unit 23
- 2634 Virginia St Unit 31
- 2634 Virginia St Unit 25
- 2634 Virginia St Unit 24
- 2634 Virginia St Unit 34
- 2634 Virginia St Unit 26
- 2634 Virginia St Unit 14
- 2634 Virginia St Unit 21
- 2634 Virginia St Unit 11
- 2634 Virginia St Unit 3
- 2634 Virginia St Unit 8
- 2634 Virginia St Unit 4
- 2634 Virginia St Unit 1
- 2634 Virginia St Unit 9
- 2634 Virginia St Unit 6
- 2634 Virginia St Unit 5
- 2634 Virginia St
- 2634 Virginia St
- 2634 Virginia St Unit 16
Your Personal Tour Guide
Ask me questions while you tour the home.