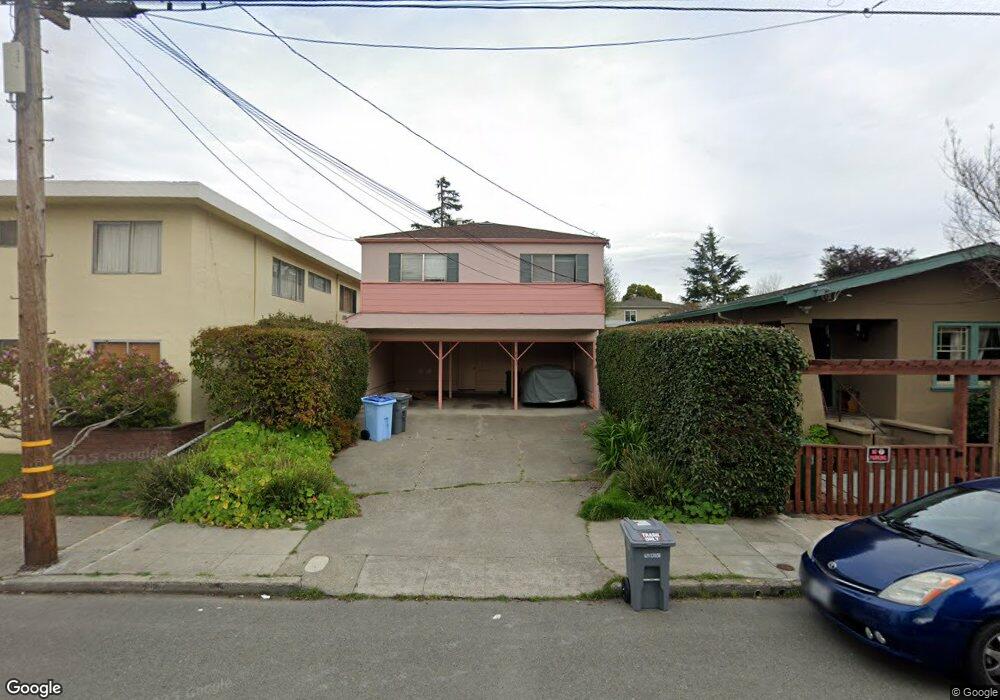
2635 California St Berkeley, CA 94703
South Berkeley NeighborhoodEstimated Value: $1,028,000 - $1,494,000
6
Beds
3
Baths
2,168
Sq Ft
$630/Sq Ft
Est. Value
About This Home
This home is located at 2635 California St, Berkeley, CA 94703 and is currently estimated at $1,366,834, approximately $630 per square foot. 2635 California St is a home located in Alameda County with nearby schools including Malcolm X Elementary School, Washington Elementary School, and Oxford Elementary School.
Ownership History
Date
Name
Owned For
Owner Type
Purchase Details
Closed on
Apr 27, 2022
Sold by
Ming Wang Ching and Ming Jenna
Bought by
2635California Llc
Current Estimated Value
Purchase Details
Closed on
Sep 12, 2020
Sold by
2635California Llc
Bought by
Wang Ching Ming and Hua Jenna
Purchase Details
Closed on
Jul 19, 2016
Sold by
Wang Ching Ming and Hua Jenna
Bought by
2635California Llc
Purchase Details
Closed on
Mar 4, 2014
Sold by
Milsum Carl M
Bought by
Wang Ching Ming
Home Financials for this Owner
Home Financials are based on the most recent Mortgage that was taken out on this home.
Original Mortgage
$588,750
Interest Rate
4.34%
Mortgage Type
New Conventional
Purchase Details
Closed on
Sep 10, 2003
Sold by
Grim Carmen and Estate Of Nellie Montgomery
Bought by
Milsum Carl M
Home Financials for this Owner
Home Financials are based on the most recent Mortgage that was taken out on this home.
Original Mortgage
$397,400
Interest Rate
6.3%
Mortgage Type
Purchase Money Mortgage
Create a Home Valuation Report for This Property
The Home Valuation Report is an in-depth analysis detailing your home's value as well as a comparison with similar homes in the area
Home Values in the Area
Average Home Value in this Area
Purchase History
| Date | Buyer | Sale Price | Title Company |
|---|---|---|---|
| 2635California Llc | -- | None Listed On Document | |
| Wang Ching Ming | -- | None Available | |
| 2635California Llc | -- | None Available | |
| Wang Ching Ming | -- | None Available | |
| Wang Ching Ming | $785,000 | Old Republic Title Company | |
| Milsum Carl M | $497,000 | Old Republic Title Company |
Source: Public Records
Mortgage History
| Date | Status | Borrower | Loan Amount |
|---|---|---|---|
| Previous Owner | Wang Ching Ming | $588,750 | |
| Previous Owner | Milsum Carl M | $397,400 |
Source: Public Records
Tax History
| Year | Tax Paid | Tax Assessment Tax Assessment Total Assessment is a certain percentage of the fair market value that is determined by local assessors to be the total taxable value of land and additions on the property. | Land | Improvement |
|---|---|---|---|---|
| 2025 | $15,675 | $962,260 | $288,678 | $673,582 |
| 2024 | $15,675 | $943,397 | $283,019 | $660,378 |
| 2023 | $15,324 | $924,901 | $277,470 | $647,431 |
| 2022 | $15,017 | $906,768 | $272,030 | $634,738 |
| 2021 | $15,030 | $888,996 | $266,699 | $622,297 |
| 2020 | $14,203 | $879,882 | $263,964 | $615,918 |
| 2019 | $13,615 | $862,635 | $258,790 | $603,845 |
| 2018 | $13,369 | $845,727 | $253,718 | $592,009 |
| 2017 | $12,884 | $829,147 | $248,744 | $580,403 |
| 2016 | $12,452 | $812,890 | $243,867 | $569,023 |
| 2015 | $12,279 | $800,684 | $240,205 | $560,479 |
| 2014 | $9,537 | $576,182 | $172,924 | $403,258 |
Source: Public Records
Map
Nearby Homes
- 1612 Parker St
- 1515 Derby St
- 1634 Blake St
- 1604 Dwight Way
- 2750 Sacramento St
- 1450 Ward St
- 2758 Sacramento St
- 1645 Dwight Way
- 2774 Sacramento St
- 2782 Sacramento St
- 2790 Sacramento St
- 2701 Grant St
- 2829 California St
- 2350 Sacramento St
- 2717 Mabel St
- 1535 Julia St
- 1901 Parker St Unit 3
- 2922 Stanton St
- 2926 Ellis St
- 1135 Parker St
- 2639 California St
- 1603 Derby St
- 1610 Carleton St
- 1607 Derby St
- 1605 Derby St
- 1601 Derby St
- 1609 Derby St
- 2640 California St
- 1542 Carleton St
- 1616 Carleton St
- 2634 California St
- 2630 California St
- 1549 Derby St
- 1613 Derby St
- 1540 Carleton St
- 1618 Carleton St
- 1545 Derby St
- 1538 Carleton St
- 1617 Derby St
- 1536 Carleton St
Your Personal Tour Guide
Ask me questions while you tour the home.