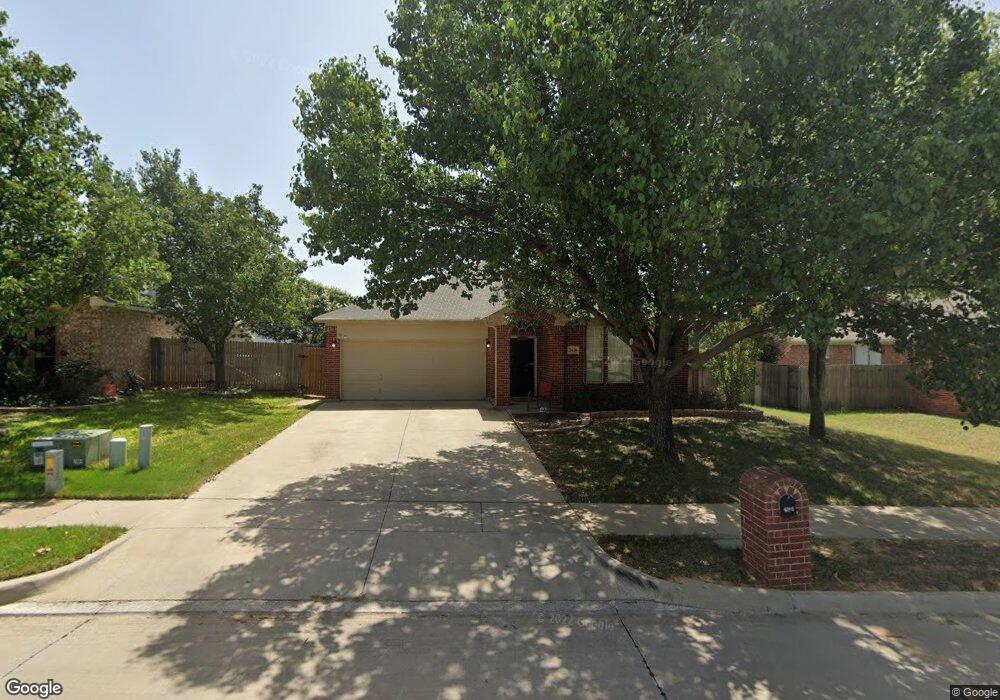
2636 Fondren Rd Denton, TX 76210
South Denton NeighborhoodEstimated Value: $316,000 - $342,000
3
Beds
2
Baths
1,624
Sq Ft
$200/Sq Ft
Est. Value
About This Home
This home is located at 2636 Fondren Rd, Denton, TX 76210 and is currently estimated at $325,133, approximately $200 per square foot. 2636 Fondren Rd is a home located in Denton County with nearby schools including Nelson Elementary School, McMath Middle School, and Denton High School.
Ownership History
Date
Name
Owned For
Owner Type
Purchase Details
Closed on
Mar 3, 2015
Sold by
Flute Roman and Flute Suzy
Bought by
American Homes 4 Rent Properties Eight L
Current Estimated Value
Purchase Details
Closed on
Nov 26, 2011
Sold by
Flute Suzanne Graves
Bought by
Flute Roman Wesley
Purchase Details
Closed on
Oct 27, 2006
Sold by
Ladusau Mark A and Ladusau Rachelle R
Bought by
Flute Roman
Home Financials for this Owner
Home Financials are based on the most recent Mortgage that was taken out on this home.
Original Mortgage
$24,200
Interest Rate
6.28%
Mortgage Type
Stand Alone Second
Purchase Details
Closed on
May 24, 2001
Sold by
Choice Home Inc
Bought by
Ladusau Mark A and Ladusau Rachelle D
Home Financials for this Owner
Home Financials are based on the most recent Mortgage that was taken out on this home.
Original Mortgage
$126,550
Interest Rate
7.01%
Mortgage Type
FHA
Create a Home Valuation Report for This Property
The Home Valuation Report is an in-depth analysis detailing your home's value as well as a comparison with similar homes in the area
Home Values in the Area
Average Home Value in this Area
Purchase History
| Date | Buyer | Sale Price | Title Company |
|---|---|---|---|
| American Homes 4 Rent Properties Eight L | $128,001 | None Available | |
| Flute Roman Wesley | -- | None Available | |
| Flute Roman | -- | Ctic | |
| Ladusau Mark A | -- | -- |
Source: Public Records
Mortgage History
| Date | Status | Borrower | Loan Amount |
|---|---|---|---|
| Previous Owner | Flute Roman | $24,200 | |
| Previous Owner | Flute Roman | $96,800 | |
| Previous Owner | Ladusau Mark A | $126,550 |
Source: Public Records
Tax History Compared to Growth
Tax History
| Year | Tax Paid | Tax Assessment Tax Assessment Total Assessment is a certain percentage of the fair market value that is determined by local assessors to be the total taxable value of land and additions on the property. | Land | Improvement |
|---|---|---|---|---|
| 2025 | $5,906 | $299,000 | $81,026 | $217,974 |
| 2024 | $5,906 | $306,000 | $81,026 | $224,974 |
| 2023 | $6,085 | $318,675 | $81,026 | $237,649 |
| 2022 | $5,325 | $250,861 | $63,886 | $186,975 |
| 2021 | $5,069 | $228,000 | $43,630 | $184,370 |
| 2020 | $4,686 | $205,000 | $43,630 | $161,370 |
| 2019 | $4,772 | $200,000 | $43,630 | $156,370 |
| 2018 | $4,155 | $172,000 | $43,630 | $128,370 |
| 2017 | $3,955 | $160,000 | $37,397 | $122,603 |
| 2016 | $3,865 | $128,000 | $37,397 | $90,603 |
| 2015 | $3,458 | $147,783 | $37,397 | $110,386 |
| 2014 | $3,458 | $138,201 | $37,397 | $100,804 |
| 2013 | -- | $121,551 | $37,397 | $84,154 |
Source: Public Records
Map
Nearby Homes
- 2617 Bissonet Dr
- 2616 Hilcroft Ave
- 2713 Hilcroft Ave
- 3900 Gessner Dr
- 2617 Hollow Ridge Dr
- 2804 Hollow Ridge Dr
- 2617 Hereford Rd
- 2817 Hereford Rd
- 2721 Arabian Ave
- 2121 Corsair Ln
- 3812 Gennaker Dr
- 3448 Tuscan Hills Cir
- 2601 Pinto Dr
- 3000 Bella Lago Dr
- 3428 Tuscan Hills Cir
- 2713 Clubhouse Dr
- 2412 Miranda Place
- 2913 Montebello Dr
- 2917 Montebello Dr
- 3009 Montebello Dr
- 2632 Fondren Rd
- 2640 Fondren Rd
- 2628 Fondren Rd
- 3828 Willowick Cir
- 2644 Fondren Rd
- 3832 Willowick Cir
- 3824 Willowick Cir
- 2613 Westheimer Rd
- 2624 Fondren Rd
- 3820 Willowick Cir
- 2612 Westheimer Rd
- 2645 Fondren Rd
- 2609 Westheimer Rd
- 2620 Fondren Rd
- 2705 San Felipe Dr
- 2701 San Felipe Dr
- 2604 Westheimer Rd
- 2605 Westheimer Rd
- 2709 San Felipe Dr
- 2649 Fondren Rd