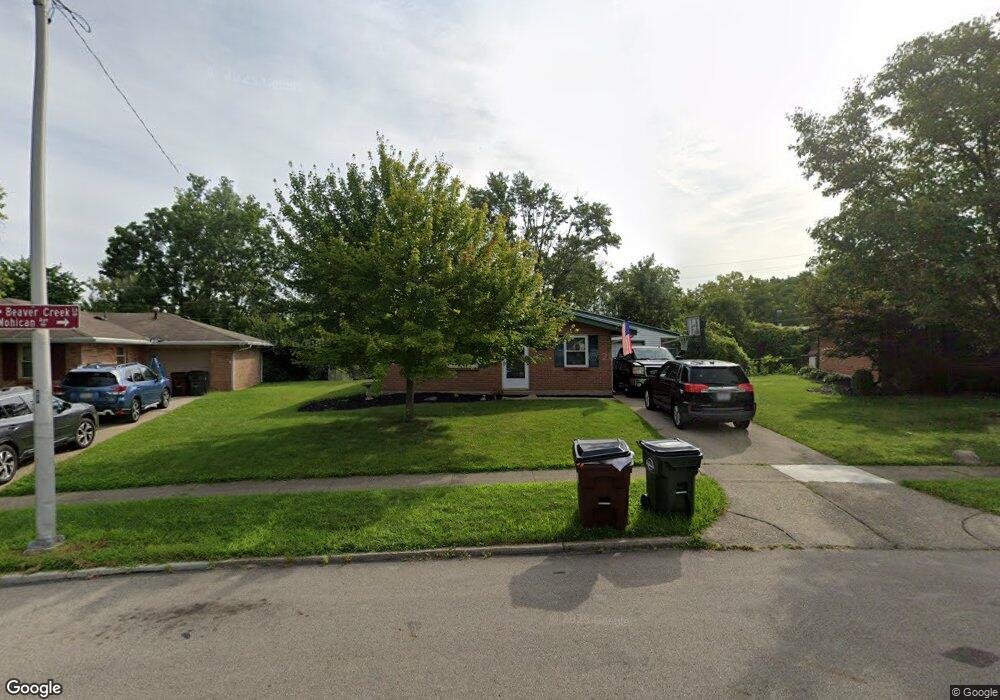
2636 Mohican Ave Dayton, OH 45429
Estimated Value: $198,000 - $205,985
3
Beds
2
Baths
1,120
Sq Ft
$181/Sq Ft
Est. Value
About This Home
This home is located at 2636 Mohican Ave, Dayton, OH 45429 and is currently estimated at $202,996, approximately $181 per square foot. 2636 Mohican Ave is a home located in Montgomery County with nearby schools including Beavertown Elementary School, Kettering Middle School, and Kettering Fairmont High School.
Ownership History
Date
Name
Owned For
Owner Type
Purchase Details
Closed on
Jun 12, 2006
Sold by
Warren David R and Warren Angela N
Bought by
Buckingham Anthony J and Girardot Amanda L
Current Estimated Value
Home Financials for this Owner
Home Financials are based on the most recent Mortgage that was taken out on this home.
Original Mortgage
$89,600
Outstanding Balance
$53,118
Interest Rate
6.72%
Mortgage Type
Purchase Money Mortgage
Estimated Equity
$149,878
Purchase Details
Closed on
Apr 28, 2000
Sold by
Scagos Neil P and Scagos Cheryl
Bought by
Warren David R and Warren Angela N
Home Financials for this Owner
Home Financials are based on the most recent Mortgage that was taken out on this home.
Original Mortgage
$80,900
Interest Rate
8.24%
Purchase Details
Closed on
Dec 16, 1994
Sold by
Tennery Thomas R and Tennery Cholea Ann
Bought by
Scagos Neil P
Create a Home Valuation Report for This Property
The Home Valuation Report is an in-depth analysis detailing your home's value as well as a comparison with similar homes in the area
Home Values in the Area
Average Home Value in this Area
Purchase History
| Date | Buyer | Sale Price | Title Company |
|---|---|---|---|
| Buckingham Anthony J | $112,000 | None Available | |
| Warren David R | $95,300 | -- | |
| Scagos Neil P | -- | -- |
Source: Public Records
Mortgage History
| Date | Status | Borrower | Loan Amount |
|---|---|---|---|
| Open | Buckingham Anthony J | $89,600 | |
| Closed | Warren David R | $80,900 |
Source: Public Records
Tax History Compared to Growth
Tax History
| Year | Tax Paid | Tax Assessment Tax Assessment Total Assessment is a certain percentage of the fair market value that is determined by local assessors to be the total taxable value of land and additions on the property. | Land | Improvement |
|---|---|---|---|---|
| 2024 | $3,203 | $50,080 | $11,350 | $38,730 |
| 2023 | $3,203 | $50,080 | $11,350 | $38,730 |
| 2022 | $3,235 | $37,310 | $8,470 | $28,840 |
| 2021 | $3,015 | $37,310 | $8,470 | $28,840 |
| 2020 | $2,808 | $37,310 | $8,470 | $28,840 |
| 2019 | $2,637 | $30,950 | $7,700 | $23,250 |
| 2018 | $2,651 | $30,950 | $7,700 | $23,250 |
| 2017 | $2,450 | $30,950 | $7,700 | $23,250 |
| 2016 | $2,325 | $27,570 | $7,700 | $19,870 |
| 2015 | $2,226 | $27,570 | $7,700 | $19,870 |
| 2014 | $2,226 | $27,570 | $7,700 | $19,870 |
| 2012 | -- | $34,050 | $8,750 | $25,300 |
Source: Public Records
Map
Nearby Homes
- 1629 Beaver Creek Ln
- 2408 Homeland Ct
- 2758 Sutton Ave
- 1417 Dutchess Ave
- 1812 E Dorothy Ln
- 1701 Marilyn Ave
- 1651 Beaverton Dr
- 3040 Ridgemore Ave
- 2729 Haig Ave
- 2845 Haig Ave
- 1116 Hale Ave
- 2040 Courtland Ave
- 3201 Beaver Ave
- 2817 Winton Dr
- 2004 Hazel Ave
- 1304 Devon Ave
- 2127 Colton Dr
- 3168 Cobblestone Ln Unit 103168
- 2116 Reardon Dr
- 1205 Kim Ln
- 1765 Beaver Creek Ln
- 2644 Mohican Ave
- 2652 Mohican Ave
- 1757 Beaver Creek Ln
- 2660 Mohican Ave
- 1749 Beaver Creek Ln
- 2668 Mohican Ave
- 2661 Mohican Ave
- 1741 Beaver Creek Ln
- 1740 Beaver Creek Ln
- 2669 Mohican Ave
- 2664 Millbrook Place
- 1733 Beaver Creek Ln
- 2676 Mohican Ave
- 2677 Mohican Ave
- 2480 Homeland Ct
- 2479 Homeland Ct
- 2684 Mohican Ave
- 1725 Beaver Creek Ln
- 2672 Millbrook Place