2636 W Brower St Springfield, MO 65802
Heart of the Westside NeighborhoodEstimated Value: $119,865 - $136,000
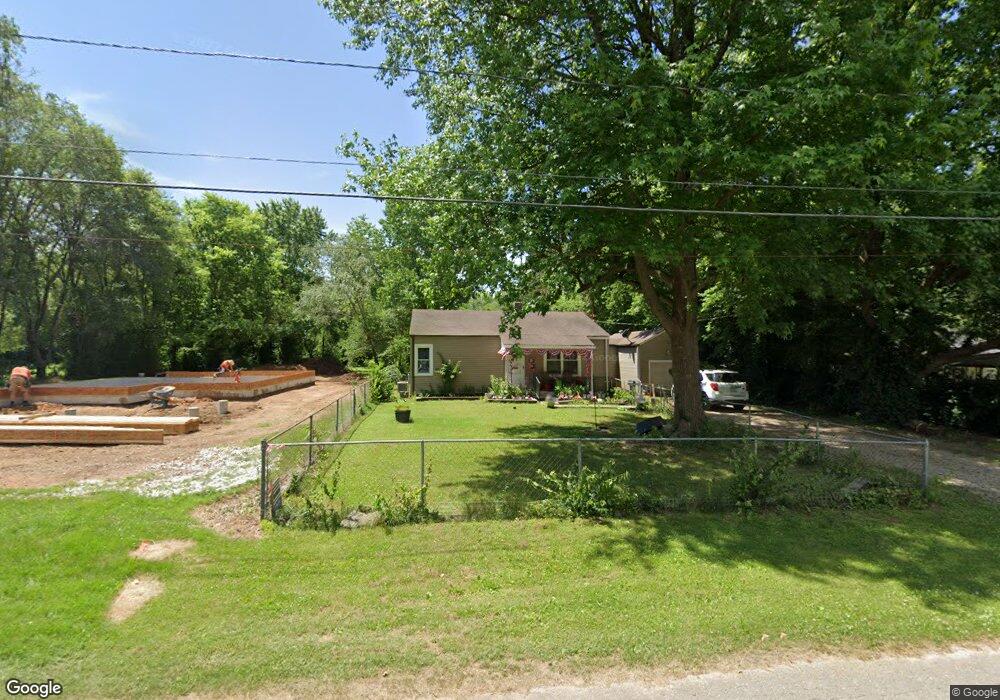
About This Home
This home is located at 2636 W Brower St, Springfield, MO 65802 and is currently estimated at $130,716, approximately $130 per square foot. 2636 W Brower St is a home located in Greene County with nearby schools including York Elementary School, Pipkin Middle School, and Central High School.
Ownership History
We collect this data history from publicly available records. To have your information removed, we recommend requesting removal directly through your county’s website.
Purchase Details
Home Financials for this Owner
Home Financials are based on the most recent Mortgage that was taken out on this home.Purchase Details
Purchase Details
Home Financials for this Owner
Home Financials are based on the most recent Mortgage that was taken out on this home.Purchase Details
Purchase Details
Home Values in the Area
Average Home Value in this Area
Purchase History
We collect this data history from publicly available records. To have your information removed, we recommend requesting removal directly through your county’s website.
| Date | Buyer | Sale Price | Title Company |
|---|---|---|---|
| -- | None Listed On Document | ||
| -- | None Listed On Document | ||
| -- | None Available | ||
| -- | Mo Kan Title Service Inc | ||
| $63,111 | Mo Kan Title Services Inc |
Mortgage History
We collect this data history from publicly available records. To have your information removed, we recommend requesting removal directly through your county’s website.
| Date | Status | Borrower | Loan Amount |
|---|---|---|---|
| Open | $2,716 | ||
| Open | $67,900 | ||
| Previous Owner | $28,000 |
Tax History
We collect this data history from publicly available records. To have your information removed, we recommend requesting removal directly through your county’s website.
| Year | Tax Paid | Tax Assessment Tax Assessment Total Assessment is a certain percentage of the fair market value that is determined by local assessors to be the total taxable value of land and additions on the property. | Land | Improvement |
|---|---|---|---|---|
| 2025 | $431 | $8,660 | $3,420 | $5,240 |
| 2024 | $411 | $7,660 | $2,850 | $4,810 |
| 2023 | $409 | $7,660 | $2,850 | $4,810 |
| 2022 | $400 | $7,320 | $2,850 | $4,470 |
| 2021 | $400 | $7,320 | $2,850 | $4,470 |
| 2020 | $411 | $7,200 | $2,850 | $4,350 |
| 2019 | $400 | $7,200 | $2,850 | $4,350 |
| 2018 | $430 | $7,750 | $2,850 | $4,900 |
| 2017 | $426 | $7,750 | $2,850 | $4,900 |
| 2016 | $425 | $7,750 | $2,850 | $4,900 |
| 2015 | $421 | $7,750 | $2,850 | $4,900 |
| 2014 | $421 | $7,700 | $2,850 | $4,850 |
Map
- 2646 W Brower St
- 819 N Brown Ave
- 811 N West Ave
- 616 N Brown Ave
- 906 N Homewood Ave
- 2730 W Chestnut St
- 1031 N Brown Ave
- 2750 W Nichols St
- 2629 W Phelps St
- 1037 N Brown Ave
- 1103 N Ethyl Ave
- 1106 N Clifton Ave
- 1037 N Fulbright Ave
- 627 N Forest Ave
- 1120 N Fulbright Ave
- 2517 W Phelps St
- 2564 W Phelps St
- 626 N Forest Ave
- 733 N Warren Ave
- 1112 N West Ave
- 2614 W Brower St
- 2608 W Brower St
- 2624 W Brower St
- 2602 W Brower St
- 2558 W Brower St
- 2611 W Brower St
- 2629 W Brower St
- 2635 W Brower St
- 2613 W Brower St
- 2557 W Brower St
- 2551 W Brower St
- 2647 W Brower St
- 755 N Brown Ave
- 753 N Brown Ave
- 2649 W Brower St
- 747 N Brown Ave
- 752 N Fulbright Ave
- 2650 W Brower St
- Lot 21 E Ferdinand Ct
- 735 S !Dnp! Ave
Ask me questions while you tour the home.