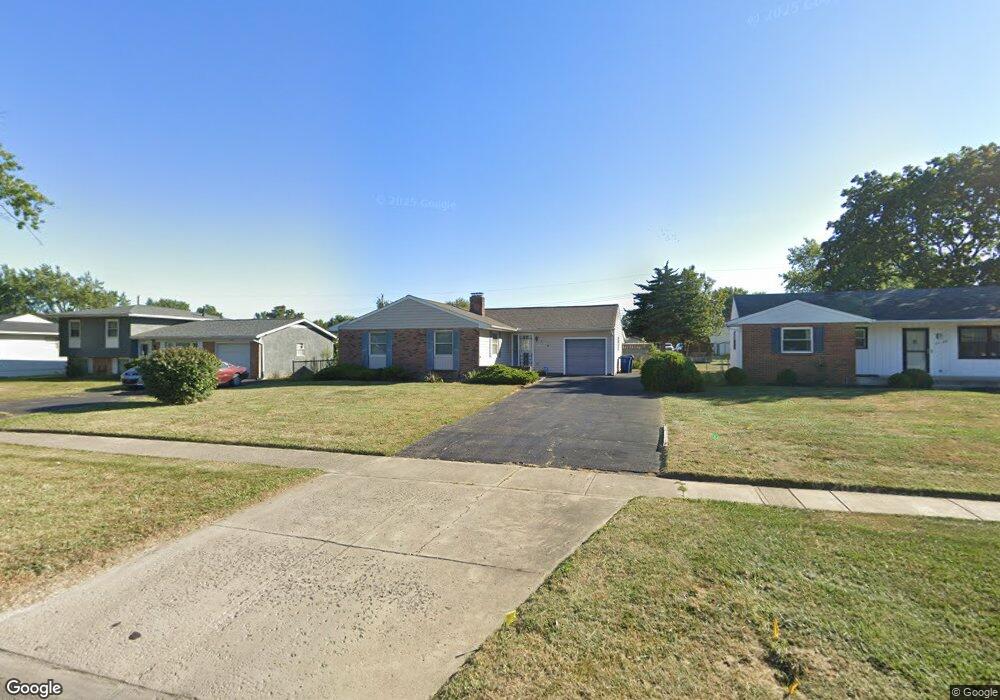
2638 N Cassady Ave Columbus, OH 43219
Somerset NeighborhoodEstimated Value: $217,000 - $315,000
3
Beds
2
Baths
1,268
Sq Ft
$212/Sq Ft
Est. Value
About This Home
This home is located at 2638 N Cassady Ave, Columbus, OH 43219 and is currently estimated at $268,525, approximately $211 per square foot. 2638 N Cassady Ave is a home located in Franklin County with nearby schools including Cassady Elementary School, Mifflin Middle School, and Mifflin High School.
Ownership History
Date
Name
Owned For
Owner Type
Purchase Details
Closed on
Jul 25, 1975
Bought by
Henderson Patricia
Current Estimated Value
Create a Home Valuation Report for This Property
The Home Valuation Report is an in-depth analysis detailing your home's value as well as a comparison with similar homes in the area
Home Values in the Area
Average Home Value in this Area
Purchase History
| Date | Buyer | Sale Price | Title Company |
|---|---|---|---|
| Henderson Patricia | -- | -- |
Source: Public Records
Tax History Compared to Growth
Tax History
| Year | Tax Paid | Tax Assessment Tax Assessment Total Assessment is a certain percentage of the fair market value that is determined by local assessors to be the total taxable value of land and additions on the property. | Land | Improvement |
|---|---|---|---|---|
| 2024 | $3,129 | $79,530 | $16,840 | $62,690 |
| 2023 | $3,117 | $79,520 | $16,835 | $62,685 |
| 2022 | $1,367 | $35,110 | $12,990 | $22,120 |
| 2021 | $1,370 | $35,110 | $12,990 | $22,120 |
| 2020 | $1,371 | $35,110 | $12,990 | $22,120 |
| 2019 | $1,281 | $29,860 | $12,990 | $16,870 |
| 2018 | $1,257 | $29,860 | $12,990 | $16,870 |
| 2017 | $1,280 | $29,860 | $12,990 | $16,870 |
| 2016 | $1,361 | $29,300 | $5,570 | $23,730 |
| 2015 | $1,236 | $29,300 | $5,570 | $23,730 |
| 2014 | $1,239 | $29,300 | $5,570 | $23,730 |
| 2013 | $657 | $30,835 | $5,845 | $24,990 |
Source: Public Records
Map
Nearby Homes
- 2795 Marbella Place
- 3241 Kenray Dr
- 3221 Caralee Dr
- 2731 Gatewood Rd
- 0 Agler Rd Unit 224000625
- 3391 Compton Dr
- 2536 Sunbury Dr
- 3427 Crossing Hill Way
- 3096 Leon Ave
- 2995 Blakehope Dr
- 0 Club House Dr
- 2683 Club House Dr
- 2520 Mccutcheon Rd
- 2118 Cornell St
- 2457 Ashpoint St
- 3678 Ashridge St
- 2559 Milford Ave
- 3601 Agler Rd
- 2193 Rustic Ledge Dr
- 3041 Baylor Ave
- 2626 N Cassady Ave
- 2644 N Cassady Ave
- 2618 N Cassady Ave
- 2650 N Cassady Ave
- 2659 Chelford Ct
- 2653 Chelford Ct
- 2667 Chelford Ct
- 2645 Chelford Ct
- 2673 Chelford Ct
- 2612 N Cassady Ave
- 2656 N Cassady Ave
- 2681 Chelford Ct
- 2639 Chelford Ct
- 2606 N Cassady Ave
- 2662 N Cassady Ave
- 3079 Chelford Dr
- 2668 Chelford Ct
- 2660 Chelford Ct
- 3063 Chelford Dr
- 2600 N Cassady Ave