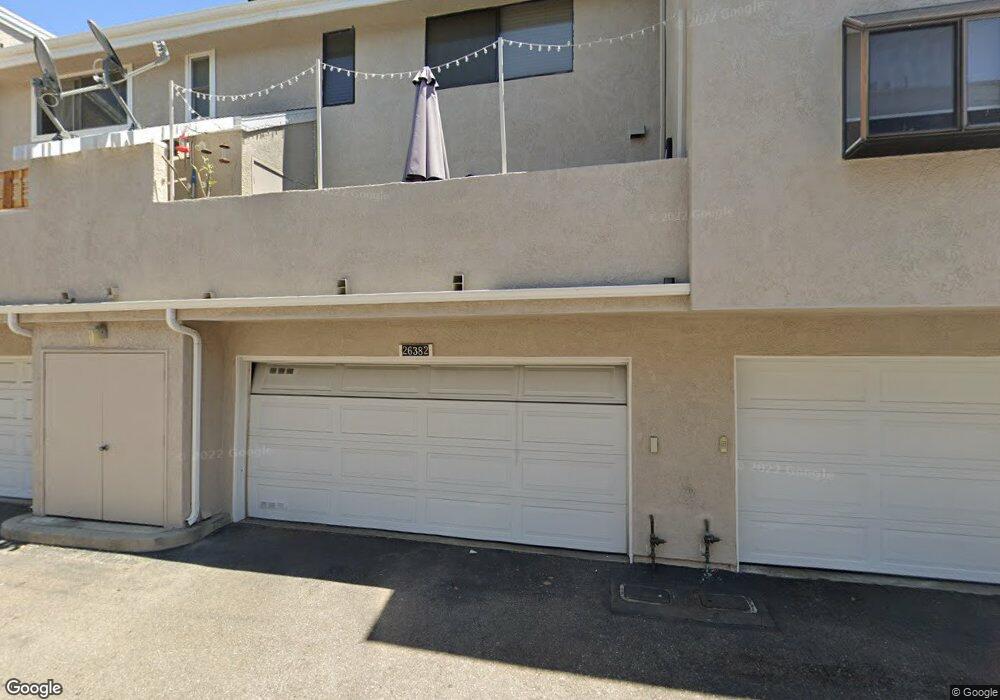
26382 Mountain Grove Cir Lake Forest, CA 92630
Estimated Value: $708,590 - $821,000
2
Beds
2
Baths
1,236
Sq Ft
$602/Sq Ft
Est. Value
About This Home
This home is located at 26382 Mountain Grove Cir, Lake Forest, CA 92630 and is currently estimated at $744,648, approximately $602 per square foot. 26382 Mountain Grove Cir is a home located in Orange County with nearby schools including Lake Forest Elementary School, Serrano Intermediate School, and El Toro High School.
Ownership History
Date
Name
Owned For
Owner Type
Purchase Details
Closed on
Oct 28, 1999
Sold by
Berg Jacqueline Marie
Bought by
Berg Kenneth Scott
Current Estimated Value
Home Financials for this Owner
Home Financials are based on the most recent Mortgage that was taken out on this home.
Original Mortgage
$161,505
Outstanding Balance
$48,207
Interest Rate
7.68%
Mortgage Type
FHA
Estimated Equity
$696,441
Purchase Details
Closed on
Oct 14, 1999
Sold by
Scott Berg Kenneth and Scott Mary E
Bought by
Schroeder Lawrence W and Schroeder Andrea J
Home Financials for this Owner
Home Financials are based on the most recent Mortgage that was taken out on this home.
Original Mortgage
$161,505
Outstanding Balance
$48,207
Interest Rate
7.68%
Mortgage Type
FHA
Estimated Equity
$696,441
Create a Home Valuation Report for This Property
The Home Valuation Report is an in-depth analysis detailing your home's value as well as a comparison with similar homes in the area
Home Values in the Area
Average Home Value in this Area
Purchase History
| Date | Buyer | Sale Price | Title Company |
|---|---|---|---|
| Berg Kenneth Scott | -- | First American Title Ins Co | |
| Schroeder Lawrence W | $166,500 | First American Title Ins Co |
Source: Public Records
Mortgage History
| Date | Status | Borrower | Loan Amount |
|---|---|---|---|
| Open | Schroeder Lawrence W | $161,505 |
Source: Public Records
Tax History Compared to Growth
Tax History
| Year | Tax Paid | Tax Assessment Tax Assessment Total Assessment is a certain percentage of the fair market value that is determined by local assessors to be the total taxable value of land and additions on the property. | Land | Improvement |
|---|---|---|---|---|
| 2025 | $2,553 | $255,893 | $108,452 | $147,441 |
| 2024 | $2,553 | $250,876 | $106,326 | $144,550 |
| 2023 | $2,492 | $245,957 | $104,241 | $141,716 |
| 2022 | $2,446 | $241,135 | $102,197 | $138,938 |
| 2021 | $2,396 | $236,407 | $100,193 | $136,214 |
| 2020 | $2,374 | $233,983 | $99,165 | $134,818 |
| 2019 | $2,325 | $229,396 | $97,221 | $132,175 |
| 2018 | $2,281 | $224,899 | $95,315 | $129,584 |
| 2017 | $2,234 | $220,490 | $93,446 | $127,044 |
| 2016 | $2,196 | $216,167 | $91,614 | $124,553 |
| 2015 | $2,168 | $212,920 | $90,237 | $122,683 |
| 2014 | $2,120 | $208,750 | $88,470 | $120,280 |
Source: Public Records
Map
Nearby Homes
- 22212 Summit Hill Dr Unit 18
- 26344 W Grove Cir Unit 65
- 26425 Sandy Creek
- 22292 Silent Brook
- 22322 Silent Brook
- 21906 Bellcroft Dr
- 22421 Rippling Brook
- 25912 Densmore Dr
- 22081 Broken Bow Dr
- 25885 Trabuco Rd Unit 206
- 25885 Trabuco Rd Unit 91
- 25885 Trabuco Rd Unit 306
- 25885 Trabuco Rd Unit 57
- 25885 Trabuco Rd Unit 33
- 25885 Trabuco Rd Unit 226
- 25885 Trabuco Rd Unit 271
- 25761 Le Parc Unit 89
- 25712 Le Parc Unit 93
- 25712 Le Parc Unit 7
- 21721 Rushford Dr
- 26384 Mountain Grove Cir Unit 59
- 26378 Mountain Grove Cir Unit 61
- 26376 Mountain Grove Cir
- 26381 Mountain Grove Cir Unit 43
- 26402 Mountain Grove Cir Unit 58
- 26383 Mountain Grove Cir Unit 44
- 26377 Mountain Grove Cir
- 26375 Mountain Grove Cir Unit 41
- 26404 Mountain Grove Cir Unit 57
- 26387 Mountain Grove Cir Unit 46
- 26391 Mountain Grove Cir
- 26385 Mountain Grove Cir Unit 45
- 26358 Mountain Grove Cir Unit 63
- 26393 Mountain Grove Cir Unit 48
- 26373 Mountain Grove Cir Unit 40
- 26373 Mountain Grove Cir
- 26395 Mountain Grove Cir Unit 49
- 26397 Mountain Grove Cir Unit 50
- 26356 Mountain Grove Cir Unit 64
- 26356 Mountain Grove Cir