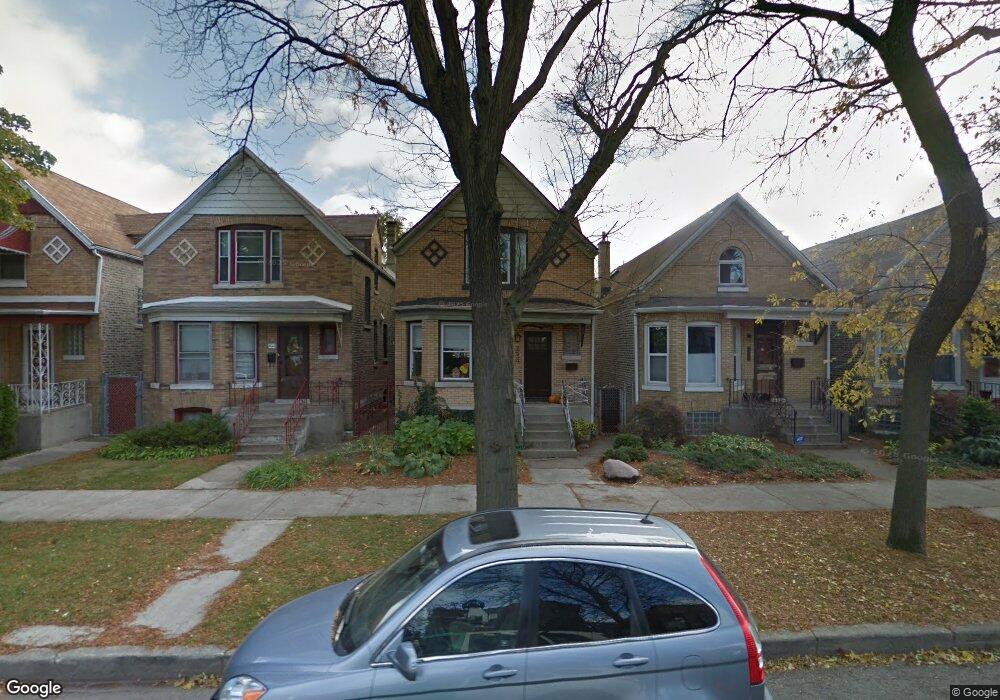
2639 N Albany Ave Chicago, IL 60647
Logan Square NeighborhoodEstimated Value: $746,000 - $1,033,062
2
Beds
3
Baths
1,937
Sq Ft
$482/Sq Ft
Est. Value
About This Home
This home is located at 2639 N Albany Ave, Chicago, IL 60647 and is currently estimated at $933,266, approximately $481 per square foot. 2639 N Albany Ave is a home located in Cook County with nearby schools including Brentano Math & Science Academy, Schurz High School, and Aspira Business & Finance High School.
Ownership History
Date
Name
Owned For
Owner Type
Purchase Details
Closed on
Nov 16, 2010
Sold by
Bloedorn Laurel
Bought by
Scatchell Ellen C and Scatchell Brian
Current Estimated Value
Home Financials for this Owner
Home Financials are based on the most recent Mortgage that was taken out on this home.
Original Mortgage
$310,814
Interest Rate
4.25%
Mortgage Type
FHA
Purchase Details
Closed on
Jul 17, 2000
Sold by
Segall Jeffrey B
Bought by
Pittel Louise
Home Financials for this Owner
Home Financials are based on the most recent Mortgage that was taken out on this home.
Original Mortgage
$100,000
Interest Rate
8.62%
Purchase Details
Closed on
Jul 2, 1997
Sold by
Flores James B
Bought by
Segall Jeffrey B
Home Financials for this Owner
Home Financials are based on the most recent Mortgage that was taken out on this home.
Original Mortgage
$138,600
Interest Rate
8.01%
Purchase Details
Closed on
Apr 26, 1994
Sold by
Roshinski Gerald J
Bought by
Flores James B
Create a Home Valuation Report for This Property
The Home Valuation Report is an in-depth analysis detailing your home's value as well as a comparison with similar homes in the area
Home Values in the Area
Average Home Value in this Area
Purchase History
| Date | Buyer | Sale Price | Title Company |
|---|---|---|---|
| Scatchell Ellen C | -- | Ctic | |
| Scatchell Ellen C | $318,000 | Ctic | |
| Pittel Louise | $259,000 | -- | |
| Segall Jeffrey B | $154,000 | -- | |
| Flores James B | -- | -- |
Source: Public Records
Mortgage History
| Date | Status | Borrower | Loan Amount |
|---|---|---|---|
| Previous Owner | Scatchell Ellen C | $310,814 | |
| Previous Owner | Pittel Louise | $100,000 | |
| Previous Owner | Segall Jeffrey B | $138,600 |
Source: Public Records
Tax History Compared to Growth
Tax History
| Year | Tax Paid | Tax Assessment Tax Assessment Total Assessment is a certain percentage of the fair market value that is determined by local assessors to be the total taxable value of land and additions on the property. | Land | Improvement |
|---|---|---|---|---|
| 2024 | $15,881 | $84,303 | $19,375 | $64,928 |
| 2023 | $15,479 | $75,000 | $15,625 | $59,375 |
| 2022 | $15,479 | $75,000 | $15,625 | $59,375 |
| 2021 | $15,131 | $75,000 | $15,625 | $59,375 |
| 2020 | $12,706 | $56,831 | $8,906 | $47,925 |
| 2019 | $12,593 | $62,452 | $8,906 | $53,546 |
| 2018 | $12,336 | $62,452 | $8,906 | $53,546 |
| 2017 | $6,878 | $31,950 | $7,812 | $24,138 |
| 2016 | $6,399 | $31,950 | $7,812 | $24,138 |
| 2015 | $5,855 | $31,950 | $7,812 | $24,138 |
| 2014 | $4,112 | $22,162 | $6,250 | $15,912 |
| 2013 | $4,031 | $22,162 | $6,250 | $15,912 |
Source: Public Records
Map
Nearby Homes
- 2708 N Albany Ave
- 2649 N Kedzie Ave Unit 4B
- 2732 N Richmond St
- 2518 N Willetts Ct Unit GS
- 2707 N Richmond St
- 2918 W Logan Blvd Unit 2E
- 2532 N Linden Place Unit 1
- 2850 N Albany Ave Unit 1N
- 3107 W George St Unit 2
- 2830 N Kedzie Ave
- 3264 W Wrightwood Ave Unit 2
- 2749 N Spaulding Ave Unit GN
- 3211 W George St Unit 2
- 2501 N Sawyer Ave
- 3106 W Fullerton Ave
- 2810 W Logan Blvd Unit 3
- 2925 N Troy St
- 2628 N Spaulding Ave Unit 1
- 2928 N Sacramento Ave
- 2832 N Mozart St
- 2637 N Albany Ave
- 2641 N Albany Ave
- 2645 N Albany Ave
- 2631 N Albany Ave
- 2647 N Albany Ave
- 2649 N Albany Ave
- 2629 N Albany Ave
- 3050 W Schubert Ave Unit 1
- 2627 N Albany Ave
- 2638 N Whipple St
- 2640 N Whipple St
- 2640 N Whipple St
- 2636 N Whipple St
- 2625 N Albany Ave
- 2644 N Whipple St
- 2634 N Whipple St
- 2630 N Whipple St
- 2638 N Albany Ave
- 2621 N Albany Ave
- 2630 N Albany Ave Unit 1