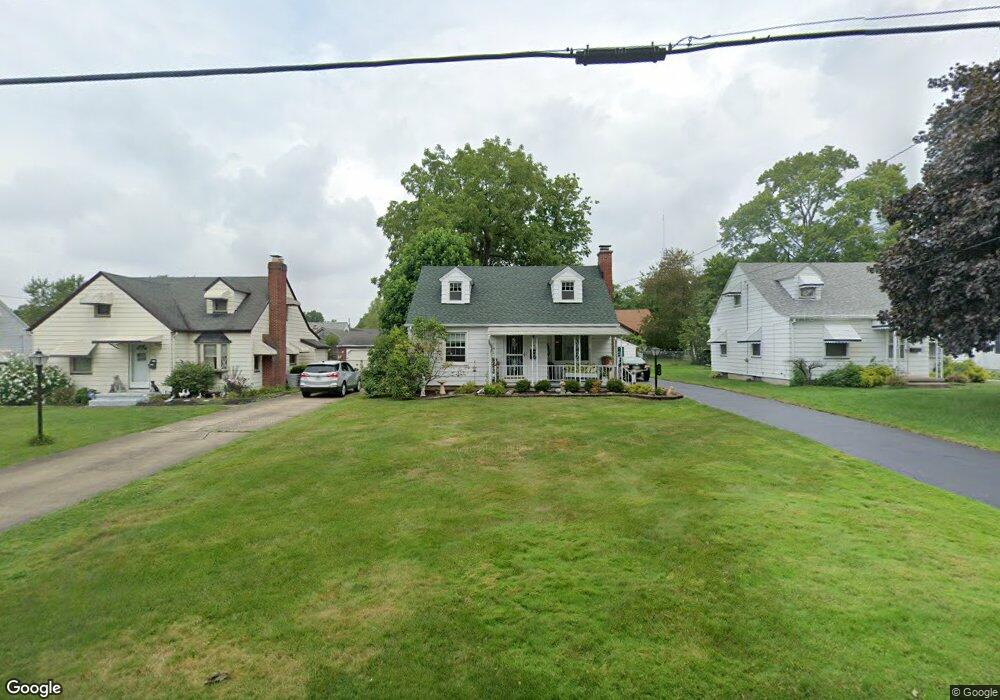
264 Afton Ave Youngstown, OH 44512
Estimated Value: $127,134 - $163,000
2
Beds
1
Bath
1,278
Sq Ft
$115/Sq Ft
Est. Value
About This Home
This home is located at 264 Afton Ave, Youngstown, OH 44512 and is currently estimated at $147,034, approximately $115 per square foot. 264 Afton Ave is a home located in Mahoning County with nearby schools including Boardman Glenwood Junior High School, Boardman High School, and Horizon Science Academy - Youngstown.
Ownership History
Date
Name
Owned For
Owner Type
Purchase Details
Closed on
Jul 17, 2012
Sold by
Sharish Cynthia A
Bought by
Sharish Cynthia L and Simerlink Thomas M
Current Estimated Value
Purchase Details
Closed on
Sep 9, 2005
Sold by
Heid Bryan T
Bought by
Sharish Cynthia L
Home Financials for this Owner
Home Financials are based on the most recent Mortgage that was taken out on this home.
Original Mortgage
$99,000
Outstanding Balance
$53,231
Interest Rate
5.93%
Mortgage Type
Purchase Money Mortgage
Estimated Equity
$93,803
Purchase Details
Closed on
Jun 18, 2003
Sold by
Whittle Richard J and Whittle Delores K
Bought by
Heid Bryan T
Home Financials for this Owner
Home Financials are based on the most recent Mortgage that was taken out on this home.
Original Mortgage
$61,600
Interest Rate
5.71%
Mortgage Type
Purchase Money Mortgage
Purchase Details
Closed on
May 20, 1988
Bought by
Whittle Richard J
Create a Home Valuation Report for This Property
The Home Valuation Report is an in-depth analysis detailing your home's value as well as a comparison with similar homes in the area
Home Values in the Area
Average Home Value in this Area
Purchase History
| Date | Buyer | Sale Price | Title Company |
|---|---|---|---|
| Sharish Cynthia L | -- | Attorney | |
| Sharish Cynthia L | $99,000 | -- | |
| Heid Bryan T | -- | Safeguard Title Agency | |
| Heid Bryan T | $77,000 | Safeguard Title Agency | |
| Whittle Richard J | -- | -- |
Source: Public Records
Mortgage History
| Date | Status | Borrower | Loan Amount |
|---|---|---|---|
| Open | Sharish Cynthia L | $99,000 | |
| Previous Owner | Heid Bryan T | $61,600 | |
| Closed | Heid Bryan T | $15,400 |
Source: Public Records
Tax History Compared to Growth
Tax History
| Year | Tax Paid | Tax Assessment Tax Assessment Total Assessment is a certain percentage of the fair market value that is determined by local assessors to be the total taxable value of land and additions on the property. | Land | Improvement |
|---|---|---|---|---|
| 2024 | $1,782 | $34,940 | $4,550 | $30,390 |
| 2023 | $1,759 | $34,940 | $4,550 | $30,390 |
| 2022 | $1,498 | $22,700 | $4,210 | $18,490 |
| 2021 | $1,499 | $22,700 | $4,210 | $18,490 |
| 2020 | $1,507 | $22,700 | $4,210 | $18,490 |
| 2019 | $1,460 | $19,410 | $3,600 | $15,810 |
| 2018 | $1,263 | $19,410 | $3,600 | $15,810 |
| 2017 | $1,327 | $19,410 | $3,600 | $15,810 |
| 2016 | $1,409 | $21,790 | $4,240 | $17,550 |
| 2015 | $1,381 | $21,790 | $4,240 | $17,550 |
| 2014 | $1,385 | $21,790 | $4,240 | $17,550 |
| 2013 | $1,368 | $21,790 | $4,240 | $17,550 |
Source: Public Records
Map
Nearby Homes
- 167 Afton Ave
- 149 Argyle Ave
- 0 Mathews Rd Unit 5038026
- 127 Melrose Ave
- 429 Tudor Ln
- 175 Homestead Dr
- 6001 Applecrest Dr
- 197 Mathews Rd Unit B
- 424 Mathews Rd
- 81 Melrose Ave
- 4715 Euclid Blvd
- 767 Indianola Rd
- 44 Gertrude Ave
- 148 Clifton Dr
- 732 Forest Ridge Dr
- 796 Edenridge Dr
- 642 Oakridge Dr
- 4552 New England Blvd
- 0 Moyer Ave
- 792 Forest Ridge Dr