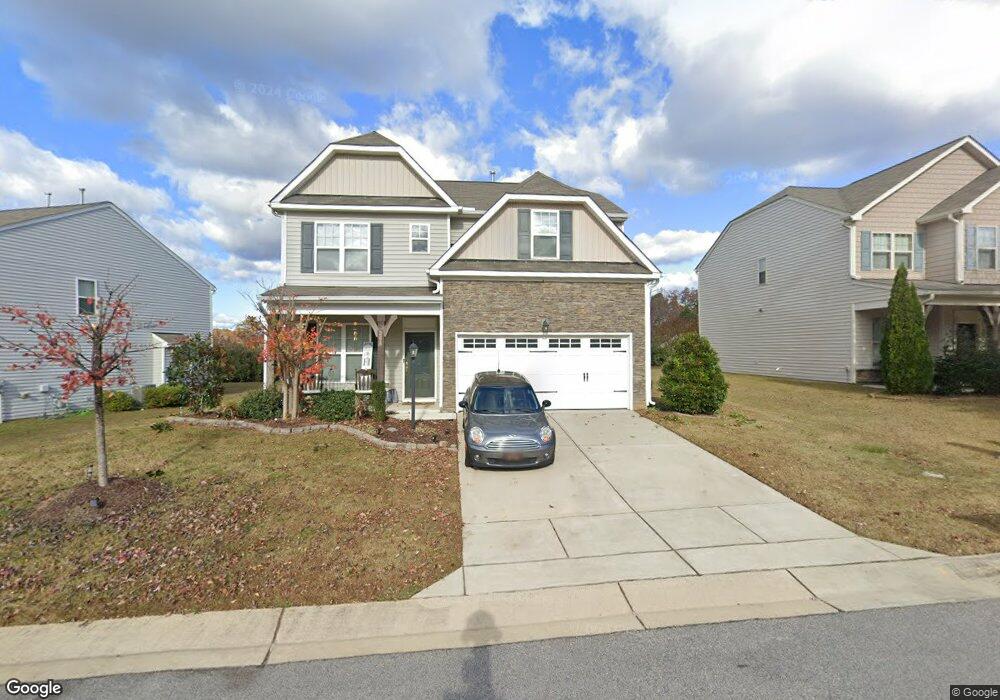
264 Naples Ln Unit 35 Clayton, NC 27527
Estimated Value: $345,000 - $378,000
4
Beds
3
Baths
2,016
Sq Ft
$180/Sq Ft
Est. Value
About This Home
This home is located at 264 Naples Ln Unit 35, Clayton, NC 27527 and is currently estimated at $361,938, approximately $179 per square foot. 264 Naples Ln Unit 35 is a home located in Johnston County with nearby schools including Riverwood Middle School, Clayton High, and Thales Academy at Flowers Plantation PreK-7.
Ownership History
Date
Name
Owned For
Owner Type
Purchase Details
Closed on
Apr 20, 2020
Sold by
Mastriana Charles R and Mastriana Allison C
Bought by
Ndwani Chantal
Current Estimated Value
Home Financials for this Owner
Home Financials are based on the most recent Mortgage that was taken out on this home.
Original Mortgage
$216,810
Outstanding Balance
$191,334
Interest Rate
3.2%
Mortgage Type
New Conventional
Estimated Equity
$170,604
Purchase Details
Closed on
Dec 9, 2016
Sold by
Terramor Homes Inc
Bought by
Mastriana Charles R and Mastriana Allison C
Home Financials for this Owner
Home Financials are based on the most recent Mortgage that was taken out on this home.
Original Mortgage
$194,749
Interest Rate
3.54%
Mortgage Type
New Conventional
Purchase Details
Closed on
Sep 7, 2016
Sold by
42 East Llc
Bought by
Terramor Homes Inc
Home Financials for this Owner
Home Financials are based on the most recent Mortgage that was taken out on this home.
Original Mortgage
$15,000,000
Interest Rate
3.48%
Mortgage Type
Construction
Create a Home Valuation Report for This Property
The Home Valuation Report is an in-depth analysis detailing your home's value as well as a comparison with similar homes in the area
Home Values in the Area
Average Home Value in this Area
Purchase History
We collect this data history from publicly available records. To have your information removed, we recommend requesting removal directly through your county’s website.
| Date | Buyer | Sale Price | Title Company |
|---|---|---|---|
| Ndwani Chantal | $241,000 | None Available | |
| Mastriana Charles R | $205,000 | None Available | |
| Terramor Homes Inc | $273,000 | None Available |
Source: Public Records
Mortgage History
We collect this data history from publicly available records. To have your information removed, we recommend requesting removal directly through your county’s website.
| Date | Status | Borrower | Loan Amount |
|---|---|---|---|
| Open | Ndwani Chantal | $216,810 | |
| Previous Owner | Mastriana Charles R | $194,749 | |
| Previous Owner | Terramor Homes Inc | $15,000,000 |
Source: Public Records
Tax History
| Year | Tax Paid | Tax Assessment Tax Assessment Total Assessment is a certain percentage of the fair market value that is determined by local assessors to be the total taxable value of land and additions on the property. | Land | Improvement |
|---|---|---|---|---|
| 2025 | $2,239 | $352,590 | $65,000 | $287,590 |
| 2024 | $1,802 | $222,450 | $48,000 | $174,450 |
| 2023 | $1,802 | $222,450 | $48,000 | $174,450 |
| 2022 | $1,824 | $222,450 | $48,000 | $174,450 |
| 2021 | $1,824 | $222,450 | $48,000 | $174,450 |
| 2020 | $1,891 | $222,450 | $48,000 | $174,450 |
| 2019 | $1,891 | $222,450 | $48,000 | $174,450 |
| 2018 | $1,587 | $182,440 | $31,000 | $151,440 |
| 2017 | $1,587 | $182,440 | $31,000 | $151,440 |
| 2016 | $270 | $31,000 | $31,000 | $0 |
Source: Public Records
Map
Nearby Homes
- 297 Bonaventure Dr
- 382 Naples Ln
- 90 Paraggi Ct
- 164 Castello Way
- 329 Florence Dr
- 26 W Milan Ct
- 13 E Milan Ct
- 141 Verona Dr
- 223 Genoa Ln
- 228 Sicily Dr
- 109 Florence Dr
- 195 Italia Ln
- 251 Sicily Dr
- 185 Stornoway Ln
- 169 W Copenhaver Dr
- 297 Diamante Dr
- 17 Stella Ct
- 361 W Copenhaver Dr
- 166 Cecina Ct
- 164 E Ravano Dr
- 264 Naples Ln
- 252 Naples Ln Unit 34
- 252 Naples Ln
- 280 Naples Ln Unit 36
- 280 Naples Ln
- 242 Naples Ln
- 208 Salerno Dr
- 300 Naples Ln Unit Homesite TJ#37
- 300 Naples Ln
- 216 Salerno Dr
- 255 Naples Ln Unit 95
- 255 Naples Ln
- 263 Naples Ln Unit 94
- 263 Naples Ln
- 320 Naples Ln Unit Homesite TJ#38
- 285 Naples Ln Unit 92
- 230 Naples Ln Unit 32
- 230 Naples Ln
- 275 Naples Ln Unit 101
- 275 Naples Ln Unit 93
Your Personal Tour Guide
Ask me questions while you tour the home.