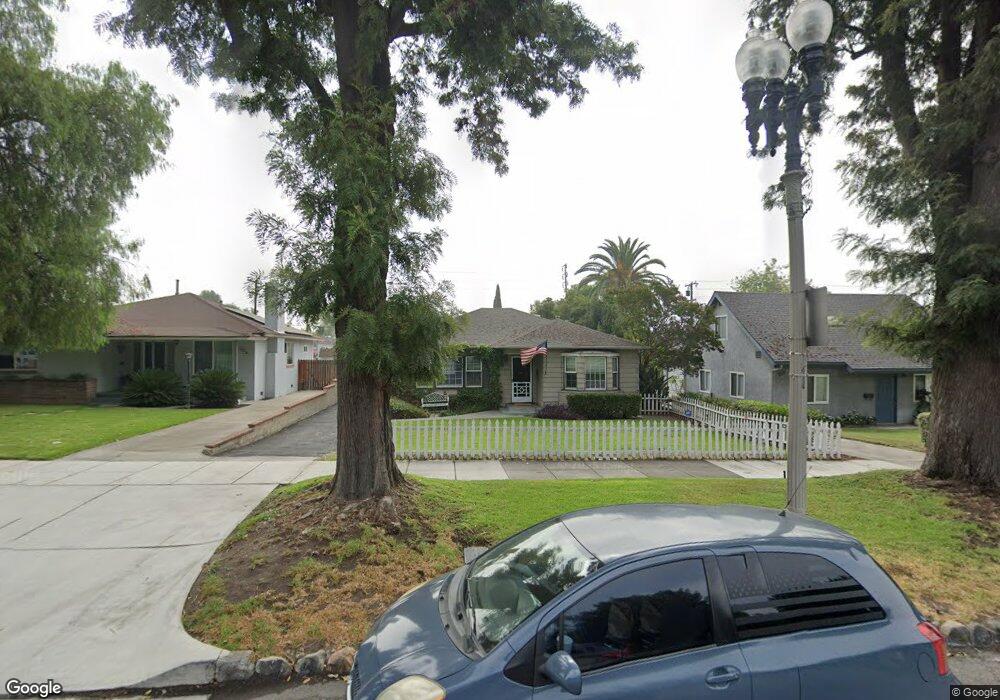
264 S Euclid Ave Upland, CA 91786
Estimated Value: $635,000 - $706,000
2
Beds
1
Bath
1,217
Sq Ft
$551/Sq Ft
Est. Value
About This Home
This home is located at 264 S Euclid Ave, Upland, CA 91786 and is currently estimated at $670,001, approximately $550 per square foot. 264 S Euclid Ave is a home located in San Bernardino County with nearby schools including Edison Elementary School, Vina Danks Middle, and Chaffey High School.
Ownership History
Date
Name
Owned For
Owner Type
Purchase Details
Closed on
Jun 4, 2018
Sold by
Pacific Diversified No 4 Llc
Bought by
Pacific Diversified No 4 Llc
Current Estimated Value
Home Financials for this Owner
Home Financials are based on the most recent Mortgage that was taken out on this home.
Original Mortgage
$234,000
Outstanding Balance
$193,707
Interest Rate
2.75%
Mortgage Type
Adjustable Rate Mortgage/ARM
Estimated Equity
$476,294
Purchase Details
Closed on
Sep 15, 2003
Sold by
Dee Joseph S
Bought by
Pacific Diversified #4 Llc
Home Financials for this Owner
Home Financials are based on the most recent Mortgage that was taken out on this home.
Original Mortgage
$199,200
Interest Rate
3.37%
Mortgage Type
Negative Amortization
Purchase Details
Closed on
Jul 17, 2002
Sold by
Dee Joseph S
Bought by
Dee Joseph S and Dee Janice M
Create a Home Valuation Report for This Property
The Home Valuation Report is an in-depth analysis detailing your home's value as well as a comparison with similar homes in the area
Home Values in the Area
Average Home Value in this Area
Purchase History
| Date | Buyer | Sale Price | Title Company |
|---|---|---|---|
| Pacific Diversified No 4 Llc | -- | Westminster Title Company | |
| Pacific Diversified #4 Llc | $249,000 | First American | |
| Dee Joseph S | -- | -- |
Source: Public Records
Mortgage History
| Date | Status | Borrower | Loan Amount |
|---|---|---|---|
| Open | Pacific Diversified No 4 Llc | $234,000 | |
| Previous Owner | Pacific Diversified #4 Llc | $199,200 | |
| Closed | Pacific Diversified #4 Llc | $24,650 |
Source: Public Records
Tax History
| Year | Tax Paid | Tax Assessment Tax Assessment Total Assessment is a certain percentage of the fair market value that is determined by local assessors to be the total taxable value of land and additions on the property. | Land | Improvement |
|---|---|---|---|---|
| 2025 | $4,081 | $354,030 | $123,910 | $230,120 |
| 2024 | $3,988 | $347,088 | $121,480 | $225,608 |
| 2023 | $3,875 | $340,282 | $119,098 | $221,184 |
| 2022 | $3,821 | $333,610 | $116,763 | $216,847 |
| 2021 | $3,794 | $327,069 | $114,474 | $212,595 |
| 2020 | $3,726 | $323,715 | $113,300 | $210,415 |
| 2019 | $3,905 | $317,367 | $111,078 | $206,289 |
| 2018 | $3,647 | $311,144 | $108,900 | $202,244 |
| 2017 | $3,517 | $305,043 | $106,765 | $198,278 |
| 2016 | $3,223 | $299,062 | $104,672 | $194,390 |
| 2015 | $3,202 | $294,570 | $103,100 | $191,470 |
| 2014 | $3,103 | $288,799 | $101,080 | $187,719 |
Source: Public Records
Map
Nearby Homes
- 296 S Laurel Ave
- 333 White Ave
- 345 Euclid Place
- 107 N 1st Ave
- 111 N 1st Ave
- 145 N 1st Ave
- 161 N 1st Ave
- 196 Eureka Place
- 144 Dorsett Ave
- 428 W 8th St
- 580 Katy Dr
- 595 Orlando Ct
- 340 W Caroline Ct
- 1550 N Bonita Ct
- 306 S Vallejo Way
- 308 S Campus Ave
- 435 W 9th St Unit B3
- 509 N Euclid Ave
- 556 D St
- 511 D St
- 270 S Euclid Ave
- 254 S Euclid Ave
- 278 S Euclid Ave
- 244 S Euclid Ave
- 263 S 1st Ave
- 236 S Euclid Ave
- 286 S Euclid Ave
- 271 S 1st Ave
- 255 S 1st Ave
- 281 S 1st Ave
- 245 S 1st Ave
- 228 S Euclid Ave
- 294 S Euclid Ave
- 287 S 1st Ave
- 237 S 1st Ave
- 61 Olive St
- 229 S 1st Ave
- 220 S Euclid Ave
- 0 Olive St Unit CV16197185
- 223 S 1st Ave
Your Personal Tour Guide
Ask me questions while you tour the home.