264 Seton Rd Buffalo, NY 14225
Cleveland Hill NeighborhoodEstimated Value: $266,367 - $295,000
About This Home
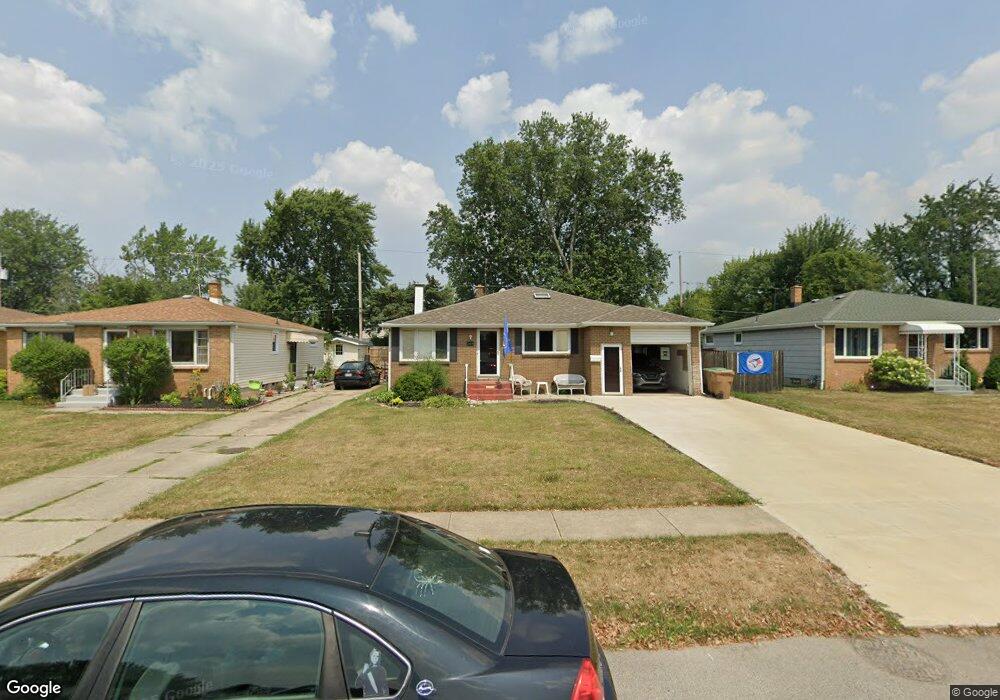
This home is located at 264 Seton Rd, Buffalo, NY 14225 and is currently estimated at $277,592, approximately $198 per square foot. 264 Seton Rd is a home located in Erie County with nearby schools including Cleveland Hill Elementary School, Cleveland Hill Middle School, and Cleveland Hill High School.
Ownership History
We collect this data history from publicly available records. To have your information removed, we recommend requesting removal directly through your county’s website.
Purchase Details
Purchase Details
Purchase Details
Purchase Details
Home Values in the Area
Average Home Value in this Area
Purchase History
We collect this data history from publicly available records. To have your information removed, we recommend requesting removal directly through your county’s website.
| Date | Buyer | Sale Price | Title Company |
|---|---|---|---|
| -- | None Available | ||
| -- | None Available | ||
| $92,000 | None Available | ||
| $75,145 | Chicago Title |
Mortgage History
We collect this data history from publicly available records. To have your information removed, we recommend requesting removal directly through your county’s website.
| Date | Status | Borrower | Loan Amount |
|---|---|---|---|
| Previous Owner | $104,420 | ||
| Previous Owner | $102,600 | ||
| Previous Owner | $25,000 | ||
| Previous Owner | $76,630 |
Tax History
We collect this data history from publicly available records. To have your information removed, we recommend requesting removal directly through your county’s website.
| Year | Tax Paid | Tax Assessment Tax Assessment Total Assessment is a certain percentage of the fair market value that is determined by local assessors to be the total taxable value of land and additions on the property. | Land | Improvement |
|---|---|---|---|---|
| 2025 | $6,359 | $184,000 | $15,500 | $168,500 |
| 2024 | $6,359 | $184,000 | $15,500 | $168,500 |
| 2023 | $6,130 | $184,000 | $15,500 | $168,500 |
| 2022 | $5,981 | $184,000 | $15,500 | $168,500 |
| 2021 | $5,922 | $160,000 | $15,500 | $144,500 |
| 2020 | $6,017 | $114,300 | $10,500 | $103,800 |
| 2019 | $4,673 | $114,300 | $10,500 | $103,800 |
| 2018 | $4,922 | $114,300 | $10,500 | $103,800 |
| 2017 | $2,496 | $114,300 | $10,500 | $103,800 |
| 2016 | $4,642 | $110,000 | $10,600 | $99,400 |
| 2015 | -- | $110,000 | $10,600 | $99,400 |
| 2014 | -- | $96,900 | $10,600 | $86,300 |
Map
- 23 Cherry Ln
- 9 Willow Ct
- 43 Oehman Blvd
- 40 Oehman Blvd
- 25 S Huxley Dr
- 226 Westbrook Dr
- 28 Cloverdale Rd
- 14 Hemenway Rd
- 91 Oehman Blvd
- 209 Westbrook Dr
- 74 S Huxley Dr
- 18 Sandstone Dr Unit 16
- 6 Springfield Dr Unit D
- 20 Lucille Dr
- 57 Elaine Ct
- 102 Hemenway Rd
- 72 Birkdale Rd
- 3 Primrose Dr
- 40 Lucille Dr
- 33-35 Brookhaven Dr
Ask me questions while you tour the home.