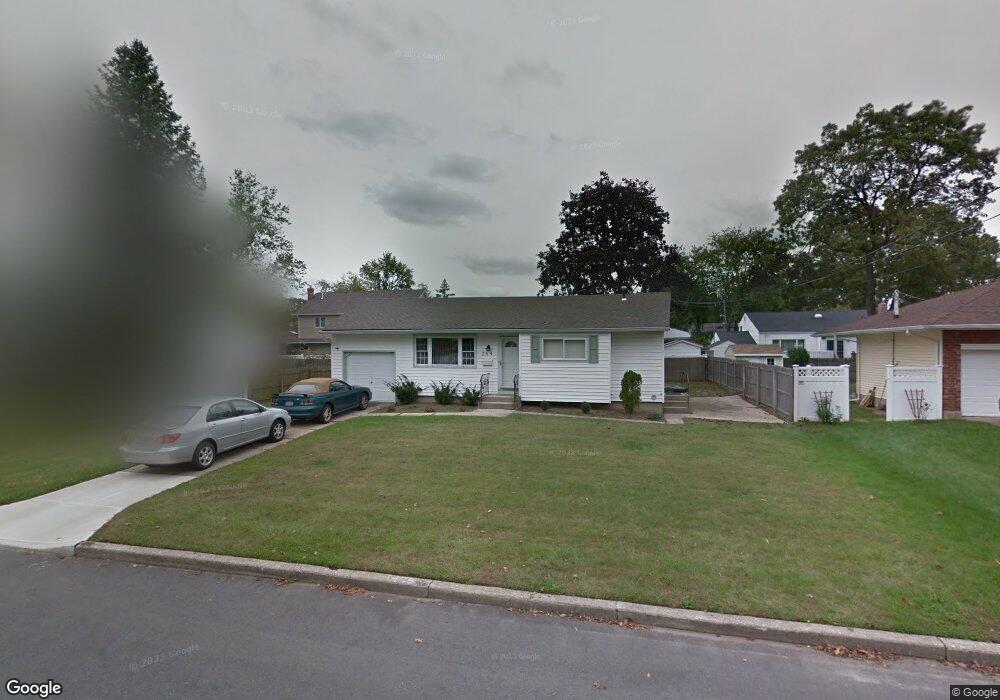
264 W 11th St Deer Park, NY 11729
Deer Park NeighborhoodEstimated Value: $486,000 - $634,071
3
Beds
1
Bath
932
Sq Ft
$616/Sq Ft
Est. Value
About This Home
This home is located at 264 W 11th St, Deer Park, NY 11729 and is currently estimated at $574,268, approximately $616 per square foot. 264 W 11th St is a home located in Suffolk County with nearby schools including Robert Frost Middle School and Deer Park High School.
Ownership History
Date
Name
Owned For
Owner Type
Purchase Details
Closed on
Mar 16, 2021
Sold by
Daniell Peter and Daniell Lisa
Bought by
Shishko William and Shishko Margaret
Current Estimated Value
Home Financials for this Owner
Home Financials are based on the most recent Mortgage that was taken out on this home.
Original Mortgage
$245,000
Interest Rate
2.8%
Mortgage Type
Stand Alone Refi Refinance Of Original Loan
Purchase Details
Closed on
Mar 9, 2007
Sold by
Administrator Novi Kathleen T
Bought by
Daniell Peter
Create a Home Valuation Report for This Property
The Home Valuation Report is an in-depth analysis detailing your home's value as well as a comparison with similar homes in the area
Home Values in the Area
Average Home Value in this Area
Purchase History
| Date | Buyer | Sale Price | Title Company |
|---|---|---|---|
| Shishko William | -- | None Available | |
| Shishko William | -- | None Available | |
| Daniell Peter | $250,000 | Scott Malin |
Source: Public Records
Mortgage History
| Date | Status | Borrower | Loan Amount |
|---|---|---|---|
| Previous Owner | Shishko William | $245,000 |
Source: Public Records
Tax History Compared to Growth
Tax History
| Year | Tax Paid | Tax Assessment Tax Assessment Total Assessment is a certain percentage of the fair market value that is determined by local assessors to be the total taxable value of land and additions on the property. | Land | Improvement |
|---|---|---|---|---|
| 2024 | $4,677 | $2,730 | $300 | $2,430 |
| 2023 | $4,677 | $2,730 | $300 | $2,430 |
| 2022 | $8,108 | $2,730 | $300 | $2,430 |
| 2021 | $8,108 | $2,730 | $300 | $2,430 |
| 2020 | $8,633 | $2,730 | $300 | $2,430 |
| 2019 | $8,633 | $0 | $0 | $0 |
| 2018 | $8,246 | $2,730 | $300 | $2,430 |
| 2017 | $8,246 | $2,730 | $300 | $2,430 |
| 2016 | $8,205 | $2,730 | $300 | $2,430 |
| 2015 | -- | $2,730 | $300 | $2,430 |
| 2014 | -- | $2,730 | $300 | $2,430 |
Source: Public Records
Map
Nearby Homes