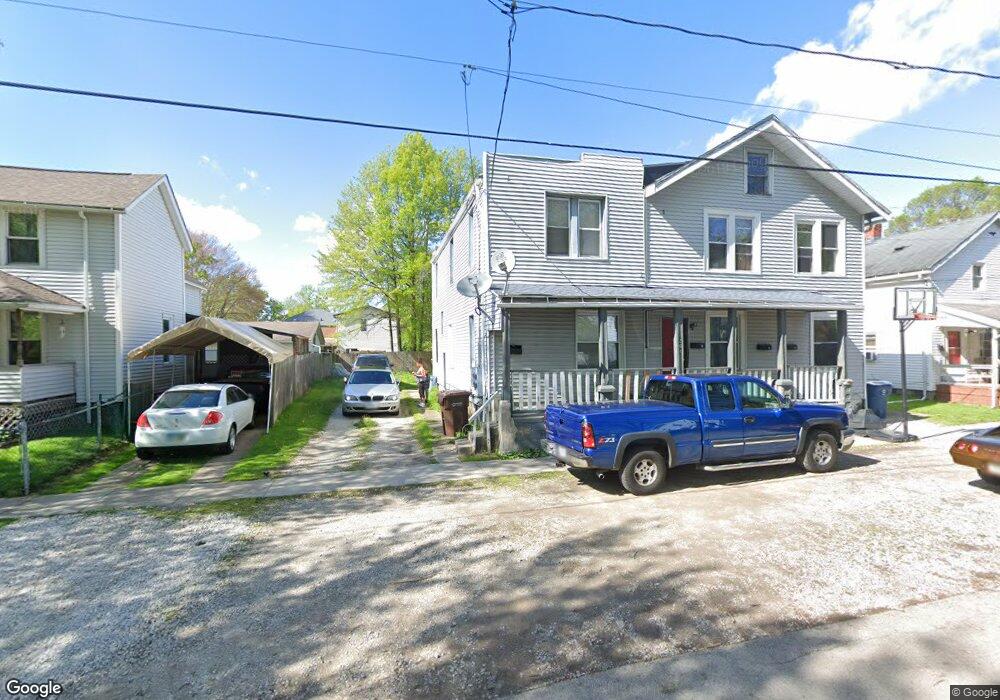
264 W Harris Ave Ravenna, OH 44266
Estimated Value: $106,562 - $140,000
3
Beds
1
Bath
1,232
Sq Ft
$98/Sq Ft
Est. Value
About This Home
This home is located at 264 W Harris Ave, Ravenna, OH 44266 and is currently estimated at $121,141, approximately $98 per square foot. 264 W Harris Ave is a home located in Portage County with nearby schools including West Main Elementary School, West Park Elementary School, and Brown Middle School.
Ownership History
Date
Name
Owned For
Owner Type
Purchase Details
Closed on
Oct 5, 2016
Sold by
Gory Frederic A and Gory Noreen
Bought by
Dynamic Results Llc
Current Estimated Value
Home Financials for this Owner
Home Financials are based on the most recent Mortgage that was taken out on this home.
Original Mortgage
$70,200
Outstanding Balance
$63,687
Interest Rate
8.75%
Mortgage Type
Adjustable Rate Mortgage/ARM
Estimated Equity
$57,454
Purchase Details
Closed on
Jul 25, 2009
Sold by
Gory Nicholas and Walczak Gary
Bought by
Gory Frederic A and Gory Nicholas
Purchase Details
Closed on
Sep 7, 2007
Sold by
Citimortgage Inc
Bought by
Gory Nicholas and Walczak Gary
Purchase Details
Closed on
Nov 21, 2006
Sold by
Hensley Kemper R and Case #2006Cv00408
Bought by
Citifinancial Mortgage Co Inc and Ford Consumer Finance Co Inc
Purchase Details
Closed on
Apr 13, 1992
Bought by
Hensley Kemper R
Create a Home Valuation Report for This Property
The Home Valuation Report is an in-depth analysis detailing your home's value as well as a comparison with similar homes in the area
Home Values in the Area
Average Home Value in this Area
Purchase History
| Date | Buyer | Sale Price | Title Company |
|---|---|---|---|
| Dynamic Results Llc | -- | Chicago Title | |
| Gory Frederic A | $10,000 | Attorney | |
| Gory Nicholas | $23,000 | Chicago Title | |
| Citifinancial Mortgage Co Inc | $59,900 | None Available | |
| Hensley Kemper R | $8,800 | -- |
Source: Public Records
Mortgage History
| Date | Status | Borrower | Loan Amount |
|---|---|---|---|
| Open | Dynamic Results Llc | $70,200 |
Source: Public Records
Tax History Compared to Growth
Tax History
| Year | Tax Paid | Tax Assessment Tax Assessment Total Assessment is a certain percentage of the fair market value that is determined by local assessors to be the total taxable value of land and additions on the property. | Land | Improvement |
|---|---|---|---|---|
| 2024 | $688 | $18,420 | $2,910 | $15,510 |
| 2023 | $553 | $12,120 | $2,910 | $9,210 |
| 2022 | $553 | $12,120 | $2,910 | $9,210 |
| 2021 | $554 | $12,120 | $2,910 | $9,210 |
| 2020 | $544 | $10,580 | $2,910 | $7,670 |
| 2019 | $545 | $10,580 | $2,910 | $7,670 |
| 2018 | $602 | $10,580 | $3,330 | $7,250 |
| 2017 | $576 | $10,580 | $3,330 | $7,250 |
| 2016 | $543 | $10,580 | $3,330 | $7,250 |
| 2015 | $543 | $10,580 | $3,330 | $7,250 |
| 2014 | $593 | $11,560 | $3,680 | $7,880 |
| 2013 | $589 | $11,560 | $3,680 | $7,880 |
Source: Public Records
Map
Nearby Homes
- 453 S Chestnut St
- 452 Mill Rd
- 159 E Harris Ave
- 450 S Walnut St
- 247 King St
- 451 Pratt St
- 208 King St
- 519 Tappan Ct
- 250 Lawrence St
- 537 Ohio Ave
- 668 Westbrook Ct
- 656 W Highland Ave
- 856 W Main St
- 110 Oakwood St
- 825 W Highland Ave
- 646 3rd St
- 1024 W Riddle Ave
- 1056 Sunnywood Ln
- 347 Elm St
- 448 Woodland St
- 264 W Harris Ave
- 262 W Harris Ave
- 260 W Harris Ave
- 604 Hill St
- 266 W Harris Ave
- 601 S Sycamore St
- 600 Hill St
- 250 W Harris Ave
- 475 S Sycamore St
- 261 W Harris Ave
- 248 W Harris Ave
- 267 W Harris Ave
- 251 W Harris Ave
- 471 S Sycamore St
- 246 W Harris Ave
- 249 W Harris Ave
- 474 S Meridian St Ravenna Oh 44266
- 621 Hill St
- 243 W Harris Ave
- 240 W Harris Ave