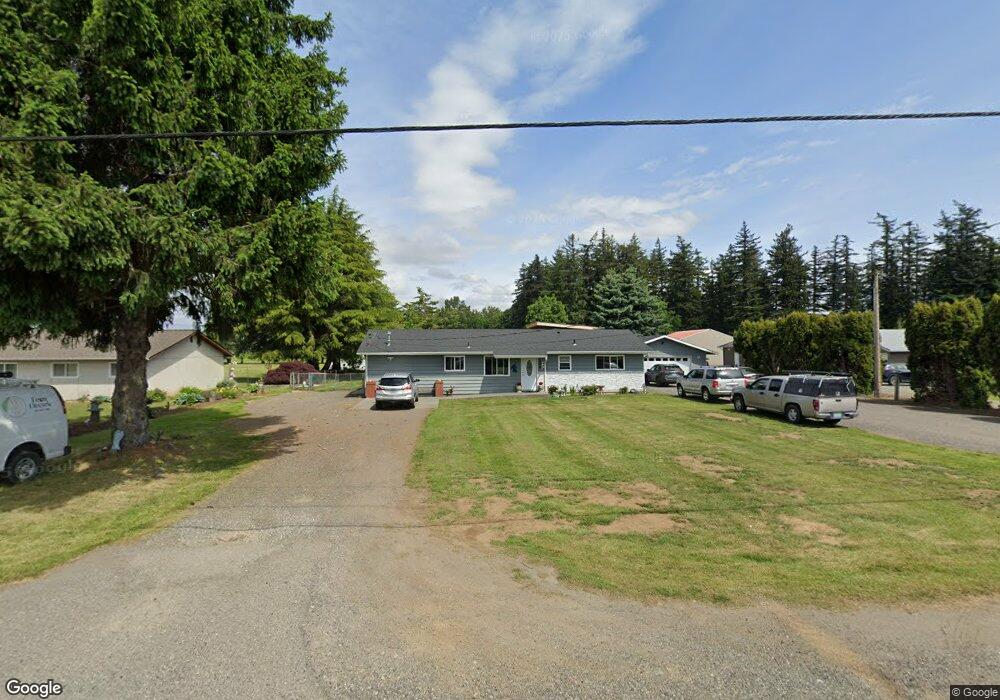
264 W Pole Rd Lynden, WA 98264
Estimated Value: $459,000 - $740,000
3
Beds
1
Bath
1,296
Sq Ft
$449/Sq Ft
Est. Value
About This Home
This home is located at 264 W Pole Rd, Lynden, WA 98264 and is currently estimated at $581,540, approximately $448 per square foot. 264 W Pole Rd is a home located in Whatcom County with nearby schools including Irene Reither Elementary School, Meridian Middle School, and Meridian High School.
Ownership History
Date
Name
Owned For
Owner Type
Purchase Details
Closed on
Nov 30, 2018
Sold by
Tackels Irene and Sosa Irene
Bought by
Tackels Irene M and Tackels Timothy M
Current Estimated Value
Home Financials for this Owner
Home Financials are based on the most recent Mortgage that was taken out on this home.
Original Mortgage
$235,000
Outstanding Balance
$207,040
Interest Rate
4.8%
Mortgage Type
New Conventional
Estimated Equity
$374,500
Purchase Details
Closed on
Aug 6, 2007
Sold by
Sosa Ernesto
Bought by
Sosa Irene
Home Financials for this Owner
Home Financials are based on the most recent Mortgage that was taken out on this home.
Original Mortgage
$255,000
Interest Rate
6.66%
Mortgage Type
Purchase Money Mortgage
Purchase Details
Closed on
Aug 3, 2007
Sold by
Widmark Margo A
Bought by
Sosa Irene
Home Financials for this Owner
Home Financials are based on the most recent Mortgage that was taken out on this home.
Original Mortgage
$255,000
Interest Rate
6.66%
Mortgage Type
Purchase Money Mortgage
Purchase Details
Closed on
Apr 20, 2000
Sold by
Widmark Lowell R
Bought by
Widmark Margo A
Create a Home Valuation Report for This Property
The Home Valuation Report is an in-depth analysis detailing your home's value as well as a comparison with similar homes in the area
Home Values in the Area
Average Home Value in this Area
Purchase History
| Date | Buyer | Sale Price | Title Company |
|---|---|---|---|
| Tackels Irene M | -- | Chicago Title | |
| Sosa Irene | -- | Chicago Title Insurance | |
| Sosa Irene | $255,280 | Chicago Title Insurance | |
| Widmark Margo A | -- | -- |
Source: Public Records
Mortgage History
| Date | Status | Borrower | Loan Amount |
|---|---|---|---|
| Open | Tackels Irene M | $235,000 | |
| Closed | Sosa Irene | $255,000 |
Source: Public Records
Tax History Compared to Growth
Tax History
| Year | Tax Paid | Tax Assessment Tax Assessment Total Assessment is a certain percentage of the fair market value that is determined by local assessors to be the total taxable value of land and additions on the property. | Land | Improvement |
|---|---|---|---|---|
| 2024 | $4,186 | $540,704 | $261,900 | $278,804 |
| 2023 | $4,186 | $538,081 | $270,000 | $268,081 |
| 2022 | $3,437 | $413,962 | $180,050 | $233,912 |
| 2021 | $3,356 | $342,113 | $148,800 | $193,313 |
| 2020 | $3,000 | $305,465 | $132,860 | $172,605 |
| 2019 | $2,633 | $273,851 | $119,110 | $154,741 |
| 2018 | $3,034 | $262,356 | $114,110 | $148,246 |
| 2017 | $3,046 | $229,915 | $100,000 | $129,915 |
| 2016 | $2,790 | $244,519 | $102,425 | $142,094 |
| 2015 | $2,687 | $222,887 | $94,775 | $128,112 |
| 2014 | -- | $208,130 | $87,975 | $120,155 |
| 2013 | -- | $198,675 | $85,000 | $113,675 |
Source: Public Records
Map
Nearby Homes
- 6852 Dutch Haven Dr
- 6830 Vail Dr
- 6818 Vail Dr
- 0 Old Guide Rd
- 7062 Guide Meridian Rd Unit 26
- 271 E Bartlett Rd
- 361 W Wiser Lake Rd
- 6864 Blumefield Dr
- 6732 La Bello Dr
- 6812 Golf View Dr Unit A
- 6037 Old Guide Rd
- 6917 Red Ridge Dr
- 7025 Hannegan Rd
- 918 Citadel Dr
- 787 E Wiser Lake Rd
- 490 W Laurel Rd
- 765 van Dyk Rd
- 7343 Hannegan Rd Unit 2
- 1257 Lattimore Rd
- 197 Bay Lyn Dr
- 272 W Pole Rd
- 258 W Pole Rd
- 205 Pollman Cir
- 207 Pollman Cir
- 280 W Pole Rd
- 209 Pollman Cir
- 309 Pollman Cir
- 211 Pollman Cir
- 208 Pollman Cir
- 6905 Edin Farms Ct
- 6863 Dutch Haven Dr
- 307 Pollman Cir
- 6904 Old Guide Rd
- 6912 Old Guide Rd
- 6915 Edin Farms Ln
- 6859 Dutch Haven Dr
- 305 Pollman Cir
- 213 Pollman Cir
- 212 Pollman Cir