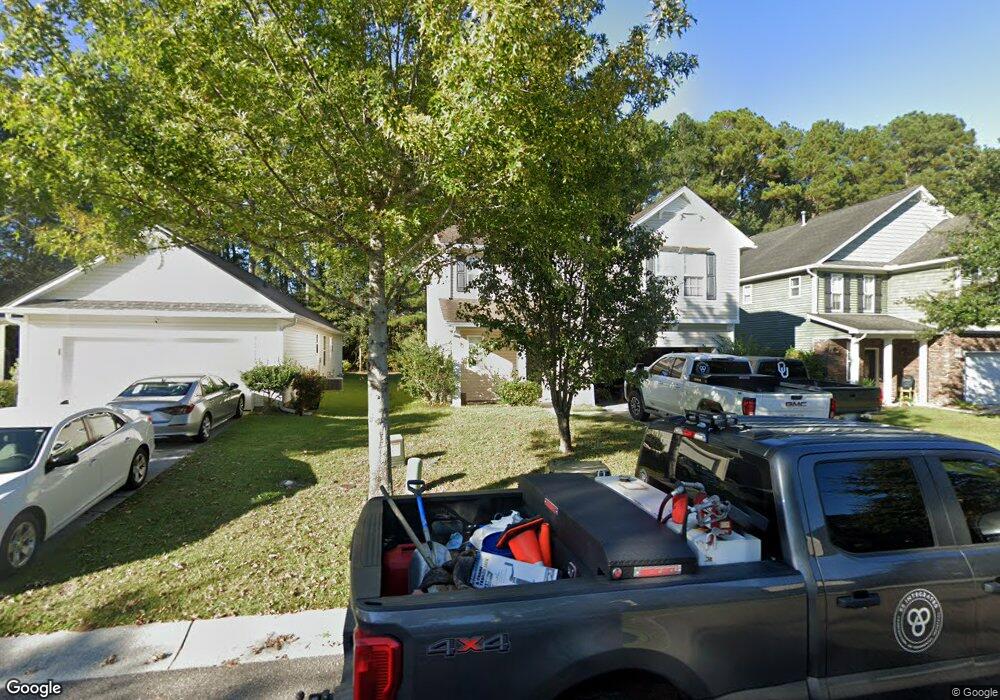
264 Woodbrook Way Moncks Corner, SC 29461
Estimated Value: $316,000 - $333,000
3
Beds
3
Baths
1,758
Sq Ft
$184/Sq Ft
Est. Value
About This Home
This home is located at 264 Woodbrook Way, Moncks Corner, SC 29461 and is currently estimated at $324,237, approximately $184 per square foot. 264 Woodbrook Way is a home located in Berkeley County with nearby schools including Foxbank Elementary School, Berkeley Middle School, and Berkeley High School.
Ownership History
Date
Name
Owned For
Owner Type
Purchase Details
Closed on
Mar 6, 2015
Sold by
American Homes 4 Rent Properties Six Llc
Bought by
Amh 2015-1 Borrower Llc
Current Estimated Value
Purchase Details
Closed on
Jun 19, 2013
Sold by
Read Nehemiah C and Read Christina H
Bought by
American Homes 4 Rent Properties Six Llc
Purchase Details
Closed on
Apr 24, 2008
Sold by
Kb Home South Carolina Inc
Bought by
Read Nehemiah C and Read Christina H
Home Financials for this Owner
Home Financials are based on the most recent Mortgage that was taken out on this home.
Original Mortgage
$180,484
Interest Rate
6.08%
Mortgage Type
FHA
Create a Home Valuation Report for This Property
The Home Valuation Report is an in-depth analysis detailing your home's value as well as a comparison with similar homes in the area
Home Values in the Area
Average Home Value in this Area
Purchase History
| Date | Buyer | Sale Price | Title Company |
|---|---|---|---|
| Amh 2015-1 Borrower Llc | -- | -- | |
| American Homes 4 Rent Properties Six Llc | $107,000 | -- | |
| Read Nehemiah C | $181,910 | -- |
Source: Public Records
Mortgage History
| Date | Status | Borrower | Loan Amount |
|---|---|---|---|
| Previous Owner | Read Nehemiah C | $180,484 |
Source: Public Records
Tax History Compared to Growth
Tax History
| Year | Tax Paid | Tax Assessment Tax Assessment Total Assessment is a certain percentage of the fair market value that is determined by local assessors to be the total taxable value of land and additions on the property. | Land | Improvement |
|---|---|---|---|---|
| 2025 | $2,284 | $141,772 | $39,294 | $102,478 |
| 2024 | $2,246 | $8,507 | $2,358 | $6,149 |
| 2023 | $2,246 | $8,507 | $2,358 | $6,149 |
| 2022 | $2,162 | $7,397 | $1,979 | $5,418 |
| 2021 | $2,178 | $7,400 | $1,979 | $5,418 |
| 2020 | $2,186 | $7,397 | $1,979 | $5,418 |
| 2019 | $2,182 | $7,397 | $1,979 | $5,418 |
| 2018 | $2,040 | $6,432 | $2,160 | $4,272 |
| 2017 | $1,961 | $6,432 | $2,160 | $4,272 |
| 2016 | $1,978 | $6,430 | $2,160 | $4,270 |
| 2015 | $1,888 | $7,420 | $2,400 | $5,020 |
| 2014 | $1,768 | $6,430 | $2,160 | $4,270 |
| 2013 | -- | $6,430 | $2,160 | $4,270 |
Source: Public Records
Map
Nearby Homes
- 261 Woodbrook Way
- 256 Woodbrook Way
- 169 Kimberton Ave
- 208 Woodbrook Way
- 117 Red Leaf Blvd
- 309 Harriswood Ln
- 202 Killarney Trail
- 330 Albrighton Way
- 169 Woodbrook Way
- 419 Thoroughbred Dr
- 201 Topsaw Ln
- 467 Thoroughbred Dr
- 427 Thoroughbred Dr
- 435 Foxbank Plantation Blvd
- 187 Red Leaf Blvd
- 244 Devonshire Dr
- 493 Trotters Ln
- 527 Crossland Dr
- 304 Fox Ridge Ln
- 535 Crossland Dr
- 266 Woodbrook Way
- 262 Woodbrook Way
- 260 Woodbrook Way
- 268 Woodbrook Way
- 270 Woodbrook Way
- 258 Woodbrook Way
- 265 Woodbrook Way
- 263 Woodbrook Way
- 267 Woodbrook Way
- 272 Woodbrook Way
- 269 Woodbrook Way
- 259 Woodbrook Way
- 275 Woodbrook Way
- 254 Woodbrook Way
- 274 Woodbrook Way
- 283 Woodbrook Way
- 168 Kimberton Ave
- 170 Kimberton Ave
- 166 Kimberton Ave
- 276 Woodbrook Way