Estimated Value: $347,074 - $355,000
3
Beds
3
Baths
1,521
Sq Ft
$231/Sq Ft
Est. Value
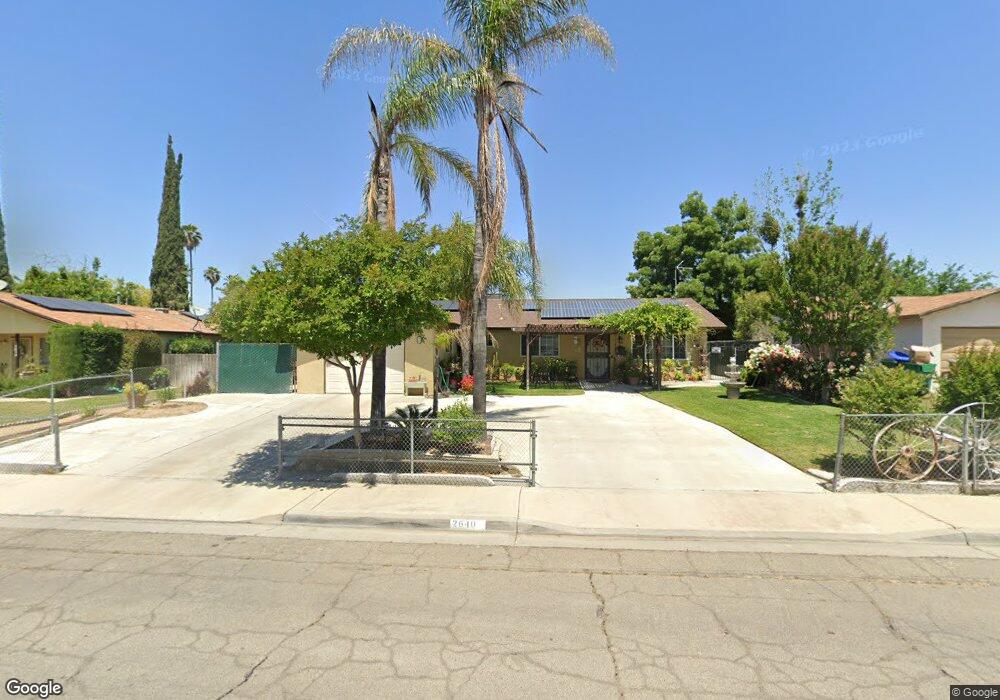
About This Home
This home is located at 2640 Aspen St, Selma, CA 93662 and is currently estimated at $351,691, approximately $231 per square foot. 2640 Aspen St is a home located in Fresno County with nearby schools including Andrew Jackson Elementary School, Abraham Lincoln Middle School, and Selma High School.
Ownership History
Date
Name
Owned For
Owner Type
Purchase Details
Closed on
Jun 29, 2022
Sold by
Alamguer Guadalupe
Bought by
Guadalupe Maria Almaguer Living Trust and Almaguer
Current Estimated Value
Purchase Details
Closed on
Oct 25, 2005
Sold by
Almaguer Jesus and Almaguer Guadalupe
Bought by
Almaguer Jesus and Almaguer Guadalupe
Home Financials for this Owner
Home Financials are based on the most recent Mortgage that was taken out on this home.
Original Mortgage
$90,000
Interest Rate
1.25%
Mortgage Type
New Conventional
Create a Home Valuation Report for This Property
The Home Valuation Report is an in-depth analysis detailing your home's value as well as a comparison with similar homes in the area
Home Values in the Area
Average Home Value in this Area
Purchase History
| Date | Buyer | Sale Price | Title Company |
|---|---|---|---|
| Guadalupe Maria Almaguer Living Trust | -- | Toomey Cynthia A | |
| Almaguer Jesus | -- | Fidelity National Title Co |
Source: Public Records
Mortgage History
| Date | Status | Borrower | Loan Amount |
|---|---|---|---|
| Previous Owner | Almaguer Jesus | $90,000 |
Source: Public Records
Tax History
| Year | Tax Paid | Tax Assessment Tax Assessment Total Assessment is a certain percentage of the fair market value that is determined by local assessors to be the total taxable value of land and additions on the property. | Land | Improvement |
|---|---|---|---|---|
| 2025 | $1,535 | $50,066 | $9,666 | $40,400 |
| 2023 | $1,025 | $48,124 | $9,292 | $38,832 |
| 2022 | $1,409 | $47,181 | $9,110 | $38,071 |
| 2021 | $1,367 | $46,257 | $8,932 | $37,325 |
| 2020 | $2,615 | $45,784 | $8,841 | $36,943 |
| 2019 | $2,565 | $44,887 | $8,668 | $36,219 |
| 2018 | $1,252 | $44,008 | $8,499 | $35,509 |
| 2017 | $1,180 | $43,146 | $8,333 | $34,813 |
| 2016 | $1,079 | $42,301 | $8,170 | $34,131 |
| 2015 | $1,084 | $41,667 | $8,048 | $33,619 |
| 2014 | $1,040 | $34,945 | $7,891 | $27,054 |
Source: Public Records
Map
Nearby Homes
- 3441 Mitchell Ave
- 3462 Shaft St
- 2606 Hillcrest St
- 2753 Thompson Ave
- 2222 Barbara St
- 2510 Whitson St
- 2561 Stillman St Unit 111
- 2221 Floral Ave
- 3654 Thompson Ave
- 3239 Lee St
- 2019 Oak St
- 2705 Hicks St
- 2020 Aspen St
- 2469 Shaft St
- 3280 Mccall Ave
- 2226 Arrants St
- 2002 Merced St
- 12623 S Mccall Ave
- 2629 Mccall Ave
- 2116 Sylvia St
Your Personal Tour Guide
Ask me questions while you tour the home.