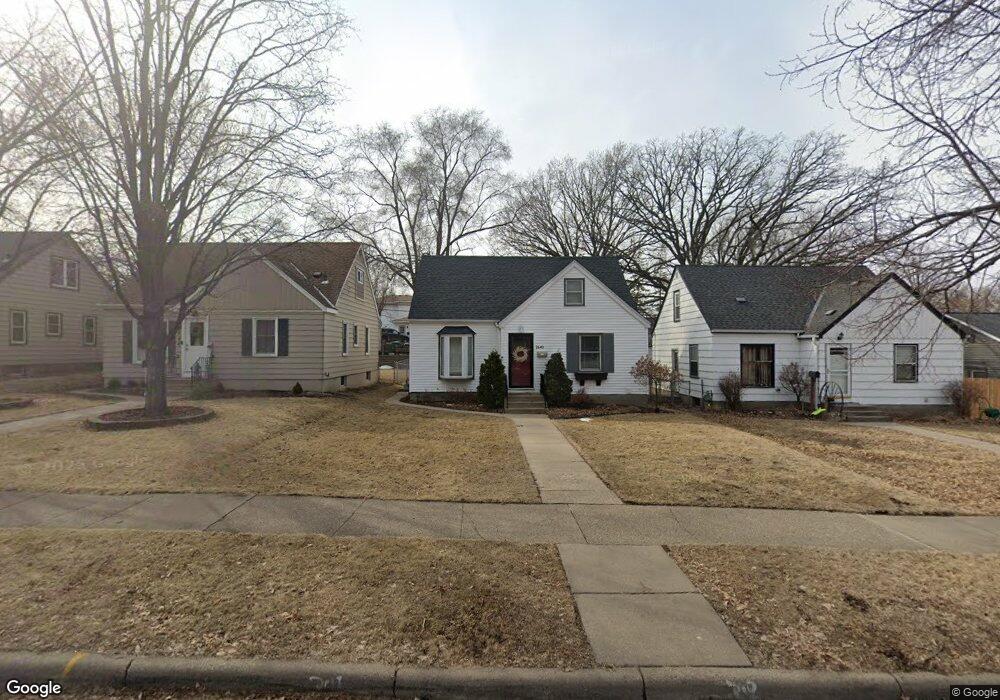
2640 Georgia Ave S Saint Louis Park, MN 55426
Bronx Park NeighborhoodEstimated Value: $467,000 - $509,319
4
Beds
3
Baths
2,066
Sq Ft
$241/Sq Ft
Est. Value
About This Home
This home is located at 2640 Georgia Ave S, Saint Louis Park, MN 55426 and is currently estimated at $497,330, approximately $240 per square foot. 2640 Georgia Ave S is a home located in Hennepin County with nearby schools including Peter Hobart Elementary School, St. Louis Park Middle School, and St. Louis Park High School.
Ownership History
Date
Name
Owned For
Owner Type
Purchase Details
Closed on
Aug 11, 2021
Sold by
Chivers Nate and Chivers Sarah
Bought by
Murphy Orrin and Murphy Kyle
Current Estimated Value
Home Financials for this Owner
Home Financials are based on the most recent Mortgage that was taken out on this home.
Original Mortgage
$422,750
Outstanding Balance
$384,411
Interest Rate
2.9%
Mortgage Type
New Conventional
Estimated Equity
$112,919
Purchase Details
Closed on
Feb 3, 2017
Sold by
Waring Constance D and Waring Michael G
Bought by
Chivers Nate and Chivers Sarah
Home Financials for this Owner
Home Financials are based on the most recent Mortgage that was taken out on this home.
Original Mortgage
$355,500
Interest Rate
4.12%
Mortgage Type
New Conventional
Purchase Details
Closed on
Aug 8, 2016
Sold by
Gale Stanley W and Gale Allan
Bought by
Waring Conne and Home Address 401K Trust
Purchase Details
Closed on
Feb 1, 2013
Sold by
Gale Florence and Goldfein Florence
Bought by
Gale Stanley W and Gale Neal
Create a Home Valuation Report for This Property
The Home Valuation Report is an in-depth analysis detailing your home's value as well as a comparison with similar homes in the area
Home Values in the Area
Average Home Value in this Area
Purchase History
| Date | Buyer | Sale Price | Title Company |
|---|---|---|---|
| Murphy Orrin | $445,000 | Edina Realty Title Inc | |
| Chivers Nate | $395,000 | Edina Realty Title Inc | |
| Waring Conne | $165,000 | Edina Realty Title Inc | |
| Gale Stanley W | -- | None Available | |
| Murphy Lorrin Lorrin | $445,000 | -- |
Source: Public Records
Mortgage History
| Date | Status | Borrower | Loan Amount |
|---|---|---|---|
| Open | Murphy Orrin | $422,750 | |
| Previous Owner | Chivers Nate | $355,500 | |
| Closed | Murphy Lorrin Lorrin | $422,750 |
Source: Public Records
Tax History Compared to Growth
Tax History
| Year | Tax Paid | Tax Assessment Tax Assessment Total Assessment is a certain percentage of the fair market value that is determined by local assessors to be the total taxable value of land and additions on the property. | Land | Improvement |
|---|---|---|---|---|
| 2024 | $7,483 | $527,100 | $129,100 | $398,000 |
| 2023 | $6,594 | $494,800 | $126,600 | $368,200 |
| 2022 | $5,952 | $494,200 | $126,000 | $368,200 |
| 2021 | $5,783 | $444,400 | $109,600 | $334,800 |
| 2020 | $5,655 | $435,900 | $104,400 | $331,500 |
| 2019 | $5,355 | $409,400 | $99,500 | $309,900 |
| 2018 | $5,374 | $376,600 | $94,800 | $281,800 |
| 2017 | $2,706 | $204,400 | $75,000 | $129,400 |
| 2016 | $2,785 | $202,900 | $67,800 | $135,100 |
| 2015 | $2,599 | $186,300 | $63,400 | $122,900 |
| 2014 | -- | $171,300 | $60,100 | $111,200 |
Source: Public Records
Map
Nearby Homes
- 2700 Georgia Ave S
- 2622 Idaho Ave S
- 2732 Idaho Ave S
- 2707 Edgewood Ave S
- 6821 W 24th St
- 2744 Dakota Ave S
- 2620 Kentucky Ave S
- 6926 W 24th St
- 2608 Kentucky Ave S
- 2852 Hampshire Ave S
- 2849 Jersey Ave S
- 2736 Brunswick Ave S
- 2925 Georgia Ave S
- 2910 Edgewood Ave S
- 7009 Cedar Lake Rd S
- 2813 Brunswick Ave S
- 2841 Brunswick Ave S
- 2563 Alabama Ave S
- 2526 Alabama Ave S
- 2644 Zarthan Ave S Unit 20
- 2644 Georgia Ave S
- 2636 Georgia Ave S
- 2644 Georgia Ave S
- 2650 Georgia Ave S
- 2630 Georgia Ave S
- 2637 Hampshire Ave S
- 2656 Georgia Ave S
- 2645 Hampshire Ave S
- 2624 Georgia Ave S
- 2633 Hampshire Ave S
- 2656 2656 Georgia-Avenue-s
- 2629 Hampshire Ave S
- 2653 Georgia Ave S
- 2645 Georgia Ave S
- 2639 Georgia Ave S
- 2620 Georgia Ave S
- 2653 Georgia Ave S
- 2625 Hampshire Ave S
- 2635 Georgia Ave S
- 2657 Georgia Ave S