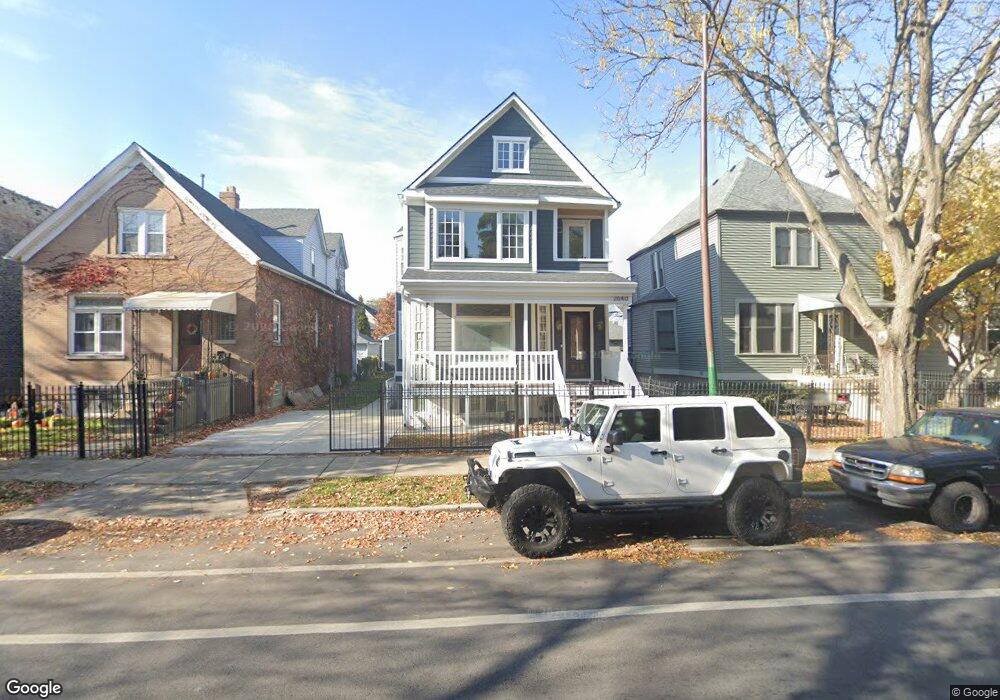
2640 N Central Park Ave Chicago, IL 60647
Logan Square NeighborhoodEstimated Value: $717,000 - $1,293,000
5
Beds
3
Baths
1,988
Sq Ft
$455/Sq Ft
Est. Value
About This Home
This home is located at 2640 N Central Park Ave, Chicago, IL 60647 and is currently estimated at $903,632, approximately $454 per square foot. 2640 N Central Park Ave is a home located in Cook County with nearby schools including Monroe Elementary School, Kelvyn Park High School, and Aspira Business & Finance High School.
Ownership History
Date
Name
Owned For
Owner Type
Purchase Details
Closed on
Aug 26, 2010
Sold by
The Bank Of New York Mellon
Bought by
Chicago Title Land Trust Company and Trust #8002355603
Current Estimated Value
Purchase Details
Closed on
Mar 12, 2010
Sold by
Pinto Hector R and Pinto Hector
Bought by
The Bank Of New York Mellon and The Bank Of New York
Purchase Details
Closed on
Sep 26, 2007
Sold by
Pinto Geydel L and Pinto Heidi L
Bought by
Pinto Hector R
Purchase Details
Closed on
Jun 4, 2001
Sold by
Pinto Heidi L
Bought by
Pinto Hector R
Purchase Details
Closed on
Oct 26, 1993
Sold by
Sanchez Carlos M and Lopez Ana L
Bought by
Pinto Hector R and Pinto Geyde L
Home Financials for this Owner
Home Financials are based on the most recent Mortgage that was taken out on this home.
Original Mortgage
$69,200
Interest Rate
6.82%
Create a Home Valuation Report for This Property
The Home Valuation Report is an in-depth analysis detailing your home's value as well as a comparison with similar homes in the area
Home Values in the Area
Average Home Value in this Area
Purchase History
| Date | Buyer | Sale Price | Title Company |
|---|---|---|---|
| Chicago Title Land Trust Company | $152,500 | None Available | |
| The Bank Of New York Mellon | -- | Premier Title | |
| Pinto Hector R | -- | None Available | |
| Pinto Hector R | -- | -- | |
| Pinto Hector R | $57,666 | -- |
Source: Public Records
Mortgage History
| Date | Status | Borrower | Loan Amount |
|---|---|---|---|
| Previous Owner | Pinto Hector R | $69,200 |
Source: Public Records
Tax History Compared to Growth
Tax History
| Year | Tax Paid | Tax Assessment Tax Assessment Total Assessment is a certain percentage of the fair market value that is determined by local assessors to be the total taxable value of land and additions on the property. | Land | Improvement |
|---|---|---|---|---|
| 2024 | $8,827 | $63,000 | $21,602 | $41,398 |
| 2023 | $8,582 | $45,000 | $17,381 | $27,619 |
| 2022 | $8,582 | $45,000 | $17,381 | $27,619 |
| 2021 | $8,408 | $45,004 | $17,385 | $27,619 |
| 2020 | $8,704 | $42,032 | $7,945 | $34,087 |
| 2019 | $8,832 | $47,228 | $7,945 | $39,283 |
| 2018 | $8,651 | $47,228 | $7,945 | $39,283 |
| 2017 | $8,746 | $44,004 | $6,952 | $37,052 |
| 2016 | $2,777 | $14,362 | $6,952 | $7,410 |
| 2015 | $7,583 | $44,004 | $6,952 | $37,052 |
| 2014 | $5,996 | $34,884 | $5,959 | $28,925 |
| 2013 | $5,866 | $34,884 | $5,959 | $28,925 |
Source: Public Records
Map
Nearby Homes
- 2706 N Monticello Ave
- 2506 N Monticello Ave
- 2736 N Monticello Ave
- 3601 W Diversey Ave
- 2435 N Monticello Ave
- 3707 W Altgeld St Unit 1
- 2512 N Kimball Ave
- 2836 N Drake Ave
- 2628 N Spaulding Ave Unit 1
- 2742 N Hamlin Ave Unit 3N
- 2837 N Ridgeway Ave
- 2343 N Lawndale Ave
- 3264 W Wrightwood Ave Unit 2
- 3815 W Diversey Ave
- 2323 N Monticello Ave
- 2633 N Springfield Ave
- 2749 N Spaulding Ave Unit GN
- 2342 N Kimball Ave
- 2521 N Springfield Ave
- 2501 N Sawyer Ave
- 2644 N Central Park Ave
- 2634 N Central Park Ave
- 2646 N Central Park Ave
- 2646 N Central Park Ave
- 2630 N Central Park Ave
- 2650 N Central Park Ave
- 2628 N Central Park Ave
- 2628 N Central Park Ave
- 2654 N Central Park Ave
- 2654 N Central Park Ave
- 2639 N Monticello Ave
- 2645 N Monticello Ave
- 2635 N Monticello Ave
- 2643 N Monticello Ave Unit 1
- 2624 N Central Park Ave
- 2624 N Central Park Ave
- 2649 N Monticello Ave
- 2647 N Monticello Ave
- 2643 N Central Park Ave
- 2656 N Central Park Ave