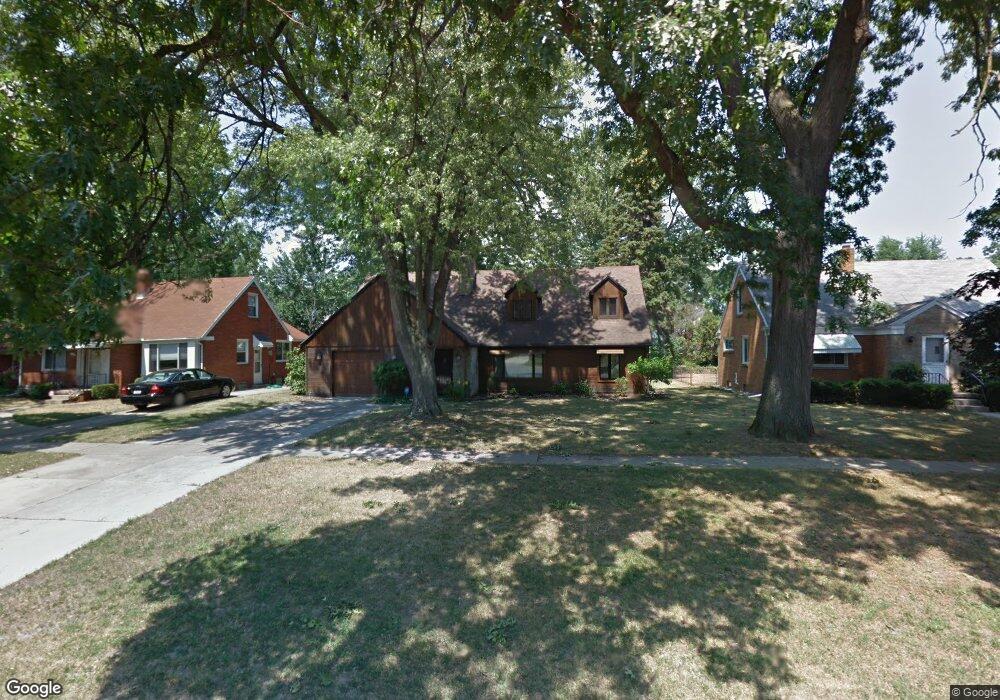
2642 Castleton Ave Toledo, OH 43613
DeVeaux NeighborhoodEstimated Value: $204,000 - $230,000
4
Beds
2
Baths
2,297
Sq Ft
$94/Sq Ft
Est. Value
About This Home
This home is located at 2642 Castleton Ave, Toledo, OH 43613 and is currently estimated at $216,689, approximately $94 per square foot. 2642 Castleton Ave is a home located in Lucas County with nearby schools including Elmhurst Elementary School, Start High School, and Horizon Science Academy - Toledo High School.
Ownership History
Date
Name
Owned For
Owner Type
Purchase Details
Closed on
Apr 30, 2015
Sold by
Spieles Joshua T and Spieles Emily
Bought by
Intagliata Dominic R
Current Estimated Value
Home Financials for this Owner
Home Financials are based on the most recent Mortgage that was taken out on this home.
Original Mortgage
$85,875
Outstanding Balance
$65,606
Interest Rate
3.77%
Mortgage Type
Future Advance Clause Open End Mortgage
Estimated Equity
$151,083
Purchase Details
Closed on
May 31, 2006
Sold by
Nelson Deane A and Nelson Vivian J
Bought by
Spieles Joshua T
Home Financials for this Owner
Home Financials are based on the most recent Mortgage that was taken out on this home.
Original Mortgage
$117,100
Interest Rate
6.66%
Mortgage Type
Purchase Money Mortgage
Purchase Details
Closed on
Jun 7, 1991
Sold by
Lawton Laura G
Purchase Details
Closed on
Oct 4, 1990
Sold by
Heiss Gary P
Create a Home Valuation Report for This Property
The Home Valuation Report is an in-depth analysis detailing your home's value as well as a comparison with similar homes in the area
Home Values in the Area
Average Home Value in this Area
Purchase History
| Date | Buyer | Sale Price | Title Company |
|---|---|---|---|
| Intagliata Dominic R | $114,500 | None Available | |
| Spieles Joshua T | $146,400 | None Available | |
| -- | $41,500 | -- | |
| -- | -- | -- |
Source: Public Records
Mortgage History
| Date | Status | Borrower | Loan Amount |
|---|---|---|---|
| Open | Intagliata Dominic R | $85,875 | |
| Previous Owner | Spieles Joshua T | $117,100 |
Source: Public Records
Tax History
| Year | Tax Paid | Tax Assessment Tax Assessment Total Assessment is a certain percentage of the fair market value that is determined by local assessors to be the total taxable value of land and additions on the property. | Land | Improvement |
|---|---|---|---|---|
| 2025 | -- | $52,710 | $9,135 | $43,575 |
| 2024 | $1,650 | $52,710 | $9,135 | $43,575 |
| 2023 | $3,105 | $47,530 | $8,085 | $39,445 |
| 2022 | $3,082 | $47,530 | $8,085 | $39,445 |
| 2021 | $3,180 | $47,530 | $8,085 | $39,445 |
| 2020 | $3,023 | $39,515 | $6,720 | $32,795 |
| 2019 | $2,929 | $39,515 | $6,720 | $32,795 |
| 2018 | $3,081 | $39,515 | $6,720 | $32,795 |
| 2017 | $3,055 | $39,690 | $6,335 | $33,355 |
| 2016 | $3,054 | $113,400 | $18,100 | $95,300 |
| 2015 | $3,058 | $113,400 | $18,100 | $95,300 |
| 2014 | $2,497 | $39,700 | $6,340 | $33,360 |
| 2013 | $2,497 | $39,700 | $6,340 | $33,360 |
Source: Public Records
Map
Nearby Homes
- 2659 Oak Grove Place
- 2313 Oak Grove Place
- 2544 Oak Grove Place
- 4726 Bowen Rd
- 2842 Oak Grove Place
- 2846 Elsie Ave
- 2834 Wyndale Rd
- 2645 Boxwood Rd
- 4214 Grantley Rd
- 4914 Bales Rd
- 4722 Bowser Dr
- 4233 Garrison Rd
- 4220 Douglas Rd
- 4807 Brott Rd
- 4402 Drummond Rd
- 4932 Bales Rd
- 4924 Roywood Rd
- 3016 Lambert Dr
- 2316 Westbrook Dr
- 2849 W Laskey Rd
- 2646 Castleton Ave
- 2634 Castleton Ave
- 2643 Oak Grove Place
- 2626 Castleton Ave
- 2656 Castleton Ave
- 2645 Oak Grove Place
- 2649 Oak Grove Place
- 2633 Oak Grove Place
- 2653 Oak Grove Place
- 2622 Castleton Ave
- 2641 Castleton Ave
- 2625 Oak Grove Place
- 2637 Castleton Ave
- 2645 Castleton Ave
- 2629 Castleton Ave
- 2649 Castleton Ave
- 2618 Castleton Ave
- 2621 Oak Grove Place
- 2653 Castleton Ave
- 2625 Castleton Ave
Your Personal Tour Guide
Ask me questions while you tour the home.