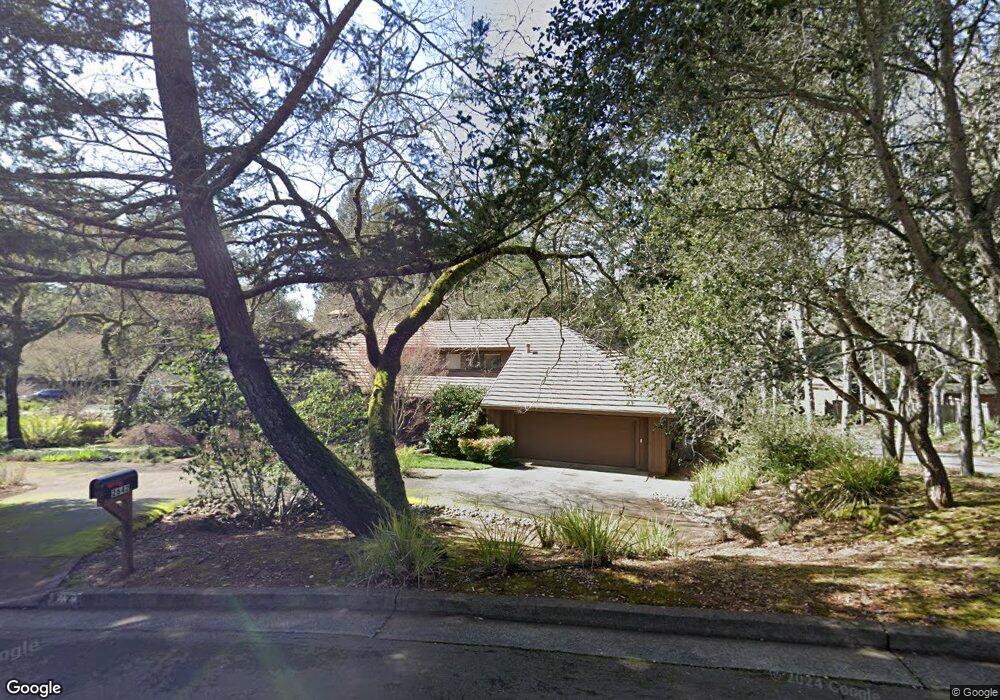
2642 Fir Park Way Santa Rosa, CA 95404
Estimated Value: $1,303,315 - $1,382,000
3
Beds
3
Baths
2,872
Sq Ft
$469/Sq Ft
Est. Value
About This Home
This home is located at 2642 Fir Park Way, Santa Rosa, CA 95404 and is currently estimated at $1,346,079, approximately $468 per square foot. 2642 Fir Park Way is a home located in Sonoma County with nearby schools including Hidden Valley Elementary School, Santa Rosa Middle School, and Santa Rosa High School.
Ownership History
Date
Name
Owned For
Owner Type
Purchase Details
Closed on
Jul 29, 1999
Sold by
Dunbar Donald C and Dunbar Wanda
Bought by
Robbins Richard J and Robbins Belvia
Current Estimated Value
Purchase Details
Closed on
Nov 22, 1998
Sold by
Dunbar Donald C and Dunbar Wanda
Bought by
Dunbar Donald C and Dunbar Wanda
Purchase Details
Closed on
Jan 29, 1997
Sold by
Cogen Lorna and Cogen Robert A
Bought by
Dunbar Donald C and Dunbar Wanda
Home Financials for this Owner
Home Financials are based on the most recent Mortgage that was taken out on this home.
Original Mortgage
$420,750
Interest Rate
7.37%
Purchase Details
Closed on
Aug 13, 1993
Sold by
Roney Patrick and Roney Laura G
Bought by
Schwartz Robert A and Cogen Lorna
Home Financials for this Owner
Home Financials are based on the most recent Mortgage that was taken out on this home.
Original Mortgage
$255,000
Interest Rate
7.2%
Create a Home Valuation Report for This Property
The Home Valuation Report is an in-depth analysis detailing your home's value as well as a comparison with similar homes in the area
Home Values in the Area
Average Home Value in this Area
Purchase History
| Date | Buyer | Sale Price | Title Company |
|---|---|---|---|
| Robbins Richard J | $600,000 | North Bay Title Co | |
| Dunbar Donald C | -- | -- | |
| Dunbar Donald C | $467,500 | Chicago Title Co | |
| Schwartz Robert A | $470,000 | Northwestern Title Co |
Source: Public Records
Mortgage History
| Date | Status | Borrower | Loan Amount |
|---|---|---|---|
| Previous Owner | Dunbar Donald C | $420,750 | |
| Previous Owner | Schwartz Robert A | $255,000 |
Source: Public Records
Tax History Compared to Growth
Tax History
| Year | Tax Paid | Tax Assessment Tax Assessment Total Assessment is a certain percentage of the fair market value that is determined by local assessors to be the total taxable value of land and additions on the property. | Land | Improvement |
|---|---|---|---|---|
| 2025 | $10,350 | $922,199 | $245,914 | $676,285 |
| 2024 | $10,350 | $904,118 | $241,093 | $663,025 |
| 2023 | $10,350 | $886,391 | $236,366 | $650,025 |
| 2022 | $9,557 | $869,012 | $231,732 | $637,280 |
| 2021 | $9,439 | $851,974 | $227,189 | $624,785 |
| 2020 | $9,417 | $843,239 | $224,860 | $618,379 |
| 2019 | $9,366 | $826,705 | $220,451 | $606,254 |
| 2018 | $9,312 | $810,496 | $216,129 | $594,367 |
| 2017 | $9,144 | $794,605 | $211,892 | $582,713 |
| 2016 | $9,086 | $779,026 | $207,738 | $571,288 |
| 2015 | $8,811 | $767,325 | $204,618 | $562,707 |
| 2014 | $7,740 | $704,000 | $188,000 | $516,000 |
Source: Public Records
Map
Nearby Homes
- 3975 Chanate Rd
- 3298 Hidden Valley Dr
- 2719 Rancho Cabeza Dr
- 3850 Montecito Ave
- 5346 Montecito Ave
- 5104 Middlebrook Ct
- 3450 Chanate Rd
- 796 Los Olivos Rd
- 1362 Manzanita Ct
- 2060 Oak Ridge Dr
- 5767 Trailwood Dr
- 3829 Moss Hollow Ct
- 3816 Clear Ridge
- 3566 Aaron Dr
- 3542 Parker Hill Ct
- 1866 Happy Valley Rd
- 2023 Beverly Way
- 3611 Alta Vista Ave
- 2140 Hyland Ct
- 2703 Brush Creek Rd
- 2648 Fir Park Way
- 2626 Fir Park Way
- 2638 Fir Park Way
- 2641 Fir Park Way
- 2634 Fir Park Way
- 2645 Fir Park Way
- 2652 Fir Park Way
- 2649 Fir Park Way
- 2620 Fir Park Way
- 2656 Fir Park Way
- 2625 Fir Park Way
- 2635 Fir Park Way
- 2653 Fir Park Way
- 3184 Montecito Meadow Dr
- 3188 Montecito Meadow Dr
- 3166 Montecito Meadow Dr
- 2610 Fir Park Way
- 3190 Montecito Meadow Dr
- 3180 Montecito Meadow Dr
- 3115 Montecito Meadow Dr