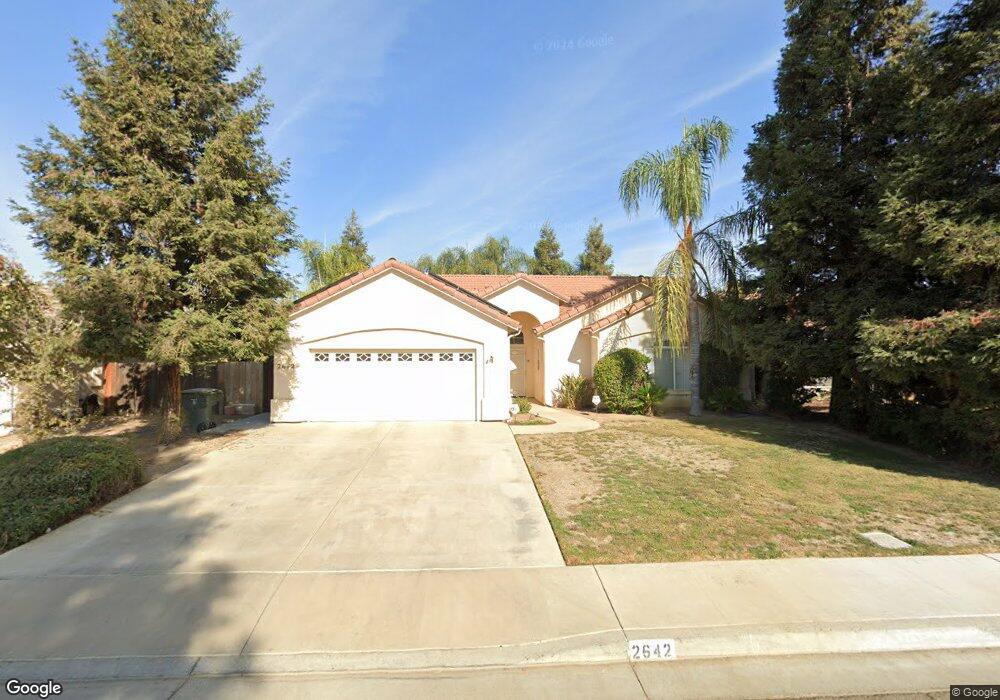
2642 W Robin Ave Visalia, CA 93291
Northwest Visalia NeighborhoodEstimated Value: $413,000 - $472,000
3
Beds
2
Baths
1,684
Sq Ft
$258/Sq Ft
Est. Value
About This Home
This home is located at 2642 W Robin Ave, Visalia, CA 93291 and is currently estimated at $435,211, approximately $258 per square foot. 2642 W Robin Ave is a home located in Tulare County with nearby schools including Riverway Elementary School, Valley Oak Middle School, and Golden West High School.
Ownership History
Date
Name
Owned For
Owner Type
Purchase Details
Closed on
Nov 26, 2013
Sold by
Oliver Larry P
Bought by
Oliver Larry P and Oliver Helene
Current Estimated Value
Purchase Details
Closed on
Jul 28, 2008
Sold by
Federal National Mortgage Association
Bought by
Edraki Parvaneh
Purchase Details
Closed on
May 7, 2008
Sold by
Moreno Tamayo Maria P and Moreno Tamayo Antonio
Bought by
Federal National Mortgage Association
Purchase Details
Closed on
Dec 29, 2005
Sold by
Smee Builders Inc
Bought by
Tamayo Antonio Moreno and Tamayo Maria P
Home Financials for this Owner
Home Financials are based on the most recent Mortgage that was taken out on this home.
Original Mortgage
$62,377
Interest Rate
6.29%
Mortgage Type
Fannie Mae Freddie Mac
Create a Home Valuation Report for This Property
The Home Valuation Report is an in-depth analysis detailing your home's value as well as a comparison with similar homes in the area
Home Values in the Area
Average Home Value in this Area
Purchase History
| Date | Buyer | Sale Price | Title Company |
|---|---|---|---|
| Oliver Larry P | -- | None Available | |
| Edraki Parvaneh | $200,000 | Fidelity National Title Co | |
| Federal National Mortgage Association | $275,557 | First American Title Company | |
| Tamayo Antonio Moreno | $312,000 | First American Title Co | |
| Smee Builders Inc | -- | First American Title Co |
Source: Public Records
Mortgage History
| Date | Status | Borrower | Loan Amount |
|---|---|---|---|
| Previous Owner | Smee Builders Inc | $62,377 | |
| Previous Owner | Tamayo Antonio Moreno | $249,508 |
Source: Public Records
Tax History Compared to Growth
Tax History
| Year | Tax Paid | Tax Assessment Tax Assessment Total Assessment is a certain percentage of the fair market value that is determined by local assessors to be the total taxable value of land and additions on the property. | Land | Improvement |
|---|---|---|---|---|
| 2025 | $2,890 | $257,548 | $64,386 | $193,162 |
| 2024 | $2,890 | $252,499 | $63,124 | $189,375 |
| 2023 | $2,816 | $247,549 | $61,887 | $185,662 |
| 2022 | $2,700 | $242,696 | $60,674 | $182,022 |
| 2021 | $2,702 | $237,937 | $59,484 | $178,453 |
| 2020 | $2,682 | $235,497 | $58,874 | $176,623 |
| 2019 | $2,597 | $230,880 | $57,720 | $173,160 |
| 2018 | $2,519 | $226,353 | $56,588 | $169,765 |
| 2017 | $2,441 | $219,000 | $55,000 | $164,000 |
| 2016 | $2,258 | $203,000 | $51,000 | $152,000 |
| 2015 | $1,934 | $191,000 | $48,000 | $143,000 |
| 2014 | $1,934 | $173,000 | $43,000 | $130,000 |
Source: Public Records
Map
Nearby Homes
- 2667 W Payson Ave
- 5035 W Sunnyview Ct Unit Syc57
- 3103 W Wren Ave
- 3137 W Delaware Ct
- 2336 N University St
- 2108 N Woodland St
- 2805 W Brooke Ave
- 2025 W Crystal Ave
- 3010 W Ceres Ave
- 2851 W Sedona Ave
- 2326 W Flagstaff Ct
- 7300 Woodbine Ave
- 3542 W Oakridge Ave
- 3005 N Dayton St
- 1833 W Corvina Ave
- 1625 W Sunnyview Ave
- 3615 W Sunnyview Ave
- 3624 N Jackie St
- 2636 W Robin Ave
- 2650 W Robin Ave
- 2622 W Robin Ave
- 2601 W Oriole Ave
- 2704 W Robin Ave
- 2551 W Oriole Ave Unit 4
- 2551 W Oriole Ave
- 2637 W Robin Ave
- 2643 W Robin Ave
- 2651 W Oriole Ave
- 2608 W Robin Ave
- 2718 W Robin Ave
- 2623 W Robin Ave
- 2701 W Robin Ave
- 2609 W Robin Ave
- 2713 W Robin Ave
- 2517 W Oriole Ave Unit 4
- 2517 W Oriole Ave
- 2726 W Robin Ave
- 2600 W Robin Ave