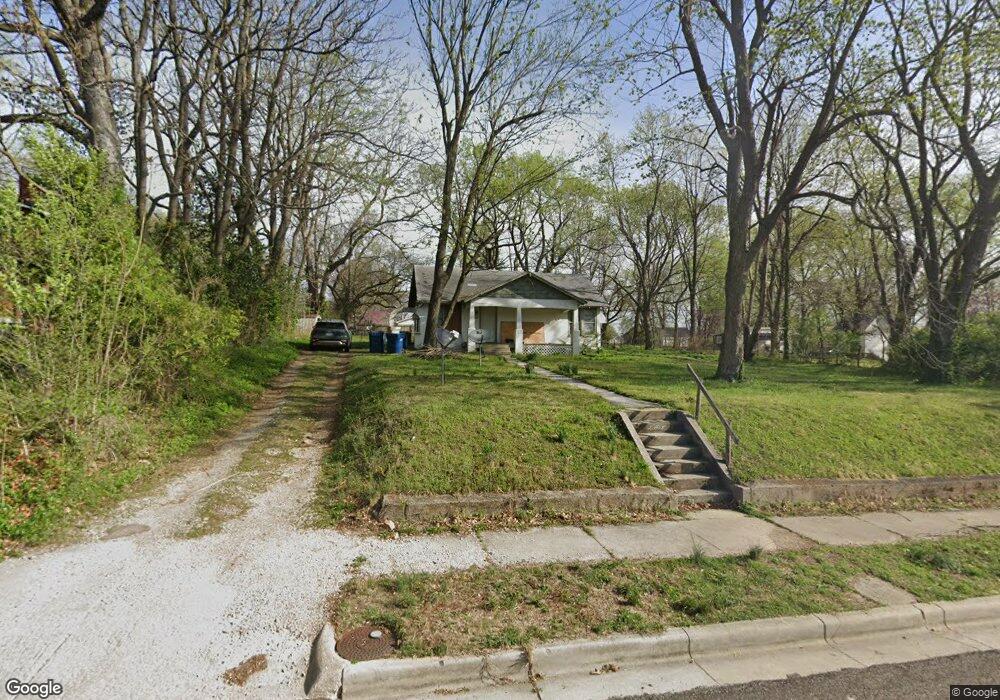
2643 E 3rd St Joplin, MO 64801
Oak Grove NeighborhoodEstimated Value: $108,448 - $141,000
2
Beds
1
Bath
1,250
Sq Ft
$104/Sq Ft
Est. Value
About This Home
This home is located at 2643 E 3rd St, Joplin, MO 64801 and is currently estimated at $130,362, approximately $104 per square foot. 2643 E 3rd St is a home located in Jasper County with nearby schools including McKinley Elementary School, East Middle School, and Joplin High School.
Ownership History
Date
Name
Owned For
Owner Type
Purchase Details
Closed on
Jun 3, 2010
Sold by
Navigator Reo Fund Manager Llc
Bought by
Steele Barbara S and Steele Richard L
Current Estimated Value
Purchase Details
Closed on
Oct 20, 2009
Sold by
Realholdings Llc
Bought by
Navigator Reo Fund Manager Llc
Purchase Details
Closed on
Aug 28, 2009
Sold by
Fannie Mae
Bought by
Realholdings Llc
Purchase Details
Closed on
Nov 14, 2008
Sold by
Kerr Kyle M
Bought by
Federal National Mortgage Association
Purchase Details
Closed on
Jan 26, 2006
Sold by
Edwards Lyn M
Bought by
Kerr Kyle M
Home Financials for this Owner
Home Financials are based on the most recent Mortgage that was taken out on this home.
Original Mortgage
$48,410
Interest Rate
6.22%
Mortgage Type
Fannie Mae Freddie Mac
Create a Home Valuation Report for This Property
The Home Valuation Report is an in-depth analysis detailing your home's value as well as a comparison with similar homes in the area
Home Values in the Area
Average Home Value in this Area
Purchase History
| Date | Buyer | Sale Price | Title Company |
|---|---|---|---|
| Steele Barbara S | $12,500 | Fatco | |
| Navigator Reo Fund Manager Llc | -- | None Available | |
| Realholdings Llc | -- | Fatco | |
| Federal National Mortgage Association | $39,523 | None Available | |
| Kerr Kyle M | -- | None Available |
Source: Public Records
Mortgage History
| Date | Status | Borrower | Loan Amount |
|---|---|---|---|
| Previous Owner | Kerr Kyle M | $48,410 |
Source: Public Records
Tax History
| Year | Tax Paid | Tax Assessment Tax Assessment Total Assessment is a certain percentage of the fair market value that is determined by local assessors to be the total taxable value of land and additions on the property. | Land | Improvement |
|---|---|---|---|---|
| 2025 | $379 | $9,060 | $2,400 | $6,660 |
| 2024 | $379 | $8,210 | $2,400 | $5,810 |
| 2023 | $379 | $8,210 | $2,400 | $5,810 |
| 2022 | $371 | $8,070 | $2,400 | $5,670 |
| 2021 | $369 | $8,070 | $2,400 | $5,670 |
| 2020 | $354 | $7,570 | $2,400 | $5,170 |
| 2019 | $354 | $7,570 | $2,400 | $5,170 |
| 2018 | $353 | $7,570 | $0 | $0 |
| 2017 | $354 | $7,570 | $0 | $0 |
| 2016 | $350 | $7,570 | $0 | $0 |
Source: Public Records
Map
Nearby Homes
- 2639 E 5th St
- 120 N Grace Ave
- 414 S Brownell Ave
- 317 Mc Connell Ave
- 605 S Ozark Ave
- 131 S Forest Ave
- 127 S Forest Ave
- 2808 E 7th St
- 115 N Forest Ave
- 1743 E Central St
- 2009 E 4th St
- 417 S Park Ave
- 2650 E 8th St
- 603 S Park Ave
- Tract 6 Jericho Ln
- 305 S Saint Louis Ave
- 930 Texas Ave
- 842 S Ozark Ave
- 1632 E 3rd St
- 1026 Texas Cir
Your Personal Tour Guide
Ask me questions while you tour the home.