
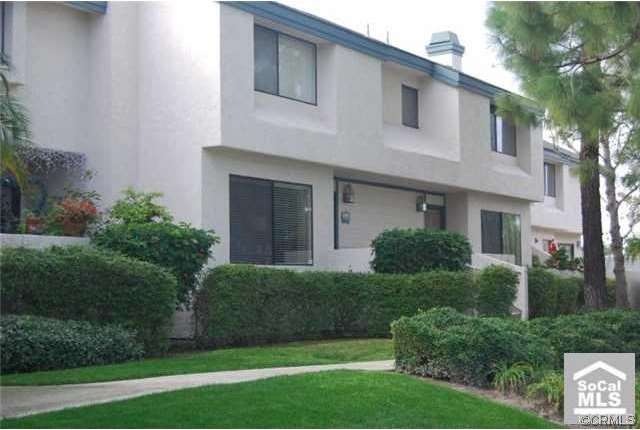
26431 Marshfield Ln Unit 31 Lake Forest, CA 92630
2
Beds
2.5
Baths
1,242
Sq Ft
$240/mo
HOA Fee
Highlights
- Private Pool
- Pool View
- Central Heating and Cooling System
- Lake Forest Elementary School Rated A-
- Laundry Room
- 4-minute walk to Montbury Park
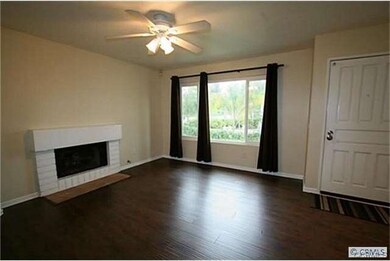
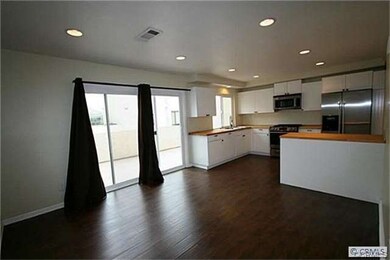
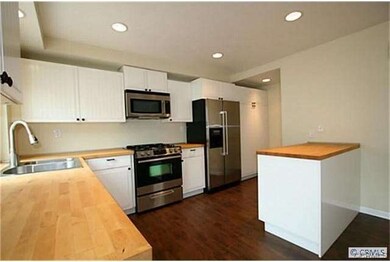
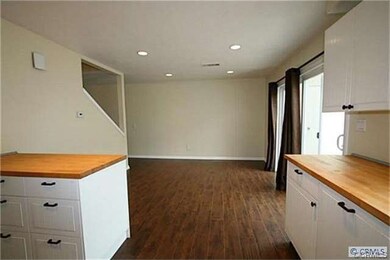
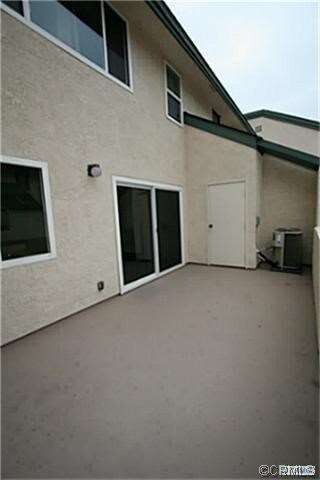
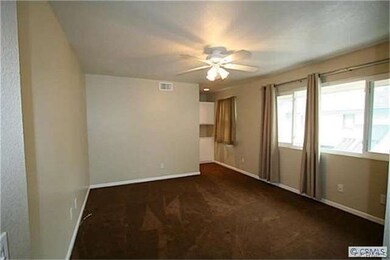
About This Home
As of August 2017Completely remodeled townhouse with 2 car attached garage with access to inside, brand new kitchen, nice upgraded laminate wood floors, new carpet, and a fantastic view of the pool from the master bedroom. Washer/Dryer hookups. Large outdoor patio with storage closet. Very conveniently located by the pool just in time for summer!
Last Agent to Sell the Property
Re/Max Real Estate Group License #00935116 Listed on: 06/10/2013
Last Buyer's Agent
Sue Johnson
Corcoran Global Living License #00688606
Property Details
Home Type
- Condominium
Est. Annual Taxes
- $5,389
Year Built
- Built in 1984
HOA Fees
- $240 Monthly HOA Fees
Parking
- 2 Car Garage
Interior Spaces
- 1,242 Sq Ft Home
- Family Room with Fireplace
- Pool Views
Bedrooms and Bathrooms
- 2 Bedrooms
- All Upper Level Bedrooms
Laundry
- Laundry Room
- Washer Hookup
Additional Features
- Private Pool
- 1 Common Wall
- Suburban Location
- Central Heating and Cooling System
Listing and Financial Details
- Tax Lot 1
- Tax Tract Number 11903
- Assessor Parcel Number 93805446
Community Details
Overview
- 200 Units
- Ritz
Recreation
- Community Pool
Ownership History
Date
Name
Owned For
Owner Type
Purchase Details
Closed on
Aug 26, 2020
Sold by
Hokama Lori
Bought by
Hokama Lori
Total Days on Market
43
Current Estimated Value
Home Financials for this Owner
Home Financials are based on the most recent Mortgage that was taken out on this home.
Original Mortgage
$456,500
Outstanding Balance
$409,686
Interest Rate
2.9%
Mortgage Type
New Conventional
Estimated Equity
$326,708
Purchase Details
Listed on
Jul 12, 2017
Closed on
Aug 1, 2017
Sold by
Jacobson Robert Marc
Bought by
Hokama Lori
Seller's Agent
Sydney Gielow
Coldwell Banker Realty
Buyer's Agent
Tamer Batniji
The Listers
List Price
$450,000
Sold Price
$465,000
Premium/Discount to List
$15,000
3.33%
Home Financials for this Owner
Home Financials are based on the most recent Mortgage that was taken out on this home.
Avg. Annual Appreciation
6.06%
Original Mortgage
$452,787
Interest Rate
3.75%
Mortgage Type
FHA
Purchase Details
Listed on
Jul 12, 2017
Closed on
Jul 19, 2017
Sold by
Benners Christopher D and Benners Christa L
Bought by
Hokama Lori
Seller's Agent
Sydney Gielow
Coldwell Banker Realty
Buyer's Agent
Tamer Batniji
The Listers
List Price
$450,000
Sold Price
$465,000
Premium/Discount to List
$15,000
3.33%
Home Financials for this Owner
Home Financials are based on the most recent Mortgage that was taken out on this home.
Original Mortgage
$452,787
Interest Rate
3.75%
Mortgage Type
FHA
Purchase Details
Closed on
Jun 9, 2015
Sold by
Benners Christopher D and Benners Christa L
Bought by
Benners 2015 Christopher D and Benners L B
Purchase Details
Listed on
Jun 10, 2013
Closed on
Jul 16, 2013
Sold by
Barnaby Holdings Llc
Bought by
Benners Christopher and Benners Christa
Seller's Agent
Ken E. Bowen
Re/Max Real Estate Group
Buyer's Agent
Sue Johnson
Corcoran Global Living
List Price
$299,000
Sold Price
$370,000
Premium/Discount to List
$71,000
23.75%
Home Financials for this Owner
Home Financials are based on the most recent Mortgage that was taken out on this home.
Avg. Annual Appreciation
6.00%
Original Mortgage
$292,000
Interest Rate
4.28%
Mortgage Type
New Conventional
Purchase Details
Closed on
Nov 30, 2011
Sold by
Barnaby Randy Joshua and Barnaby Melissa
Bought by
Barnaby Holdings Llc
Purchase Details
Closed on
Mar 29, 2011
Sold by
Chestnut Julie and Chestnut Paul
Bought by
Barnaby Randy Joshua and Barnaby Melissa
Purchase Details
Closed on
Jul 13, 2004
Sold by
Chestnut Julie
Bought by
Chestnut Paul and Chestnut Julie
Home Financials for this Owner
Home Financials are based on the most recent Mortgage that was taken out on this home.
Original Mortgage
$316,000
Interest Rate
6.75%
Mortgage Type
Purchase Money Mortgage
Purchase Details
Closed on
Oct 28, 2002
Sold by
Chestnut Paul
Bought by
Chest Julie Anne
Home Financials for this Owner
Home Financials are based on the most recent Mortgage that was taken out on this home.
Original Mortgage
$261,415
Interest Rate
5.99%
Mortgage Type
FHA
Purchase Details
Closed on
Sep 18, 2002
Sold by
Sorge Roland Karl
Bought by
Chestnut Julie
Home Financials for this Owner
Home Financials are based on the most recent Mortgage that was taken out on this home.
Original Mortgage
$261,415
Interest Rate
5.99%
Mortgage Type
FHA
Purchase Details
Closed on
May 24, 2001
Sold by
Sorge Julie Lynn
Bought by
Sorge Roland Karl
Home Financials for this Owner
Home Financials are based on the most recent Mortgage that was taken out on this home.
Original Mortgage
$168,000
Interest Rate
7.14%
Purchase Details
Closed on
Feb 15, 1994
Sold by
Sorge Irmgard
Bought by
Sorge Roland Karl
Home Financials for this Owner
Home Financials are based on the most recent Mortgage that was taken out on this home.
Original Mortgage
$123,000
Interest Rate
6.98%
Similar Homes in the area
Create a Home Valuation Report for This Property
The Home Valuation Report is an in-depth analysis detailing your home's value as well as a comparison with similar homes in the area
Home Values in the Area
Average Home Value in this Area
Purchase History
| Date | Type | Sale Price | Title Company |
|---|---|---|---|
| Interfamily Deed Transfer | -- | Wfg National Title Co Of Ca | |
| Deed | -- | Equity Title | |
| Grant Deed | $465,000 | Equity Title | |
| Interfamily Deed Transfer | -- | None Available | |
| Interfamily Deed Transfer | -- | None Available | |
| Grant Deed | $370,000 | Ticor Title | |
| Grant Deed | -- | None Available | |
| Grant Deed | $225,000 | Orange Coast Title | |
| Interfamily Deed Transfer | -- | Fidelity National Title | |
| Interfamily Deed Transfer | -- | Fidelity National Title | |
| Grant Deed | $269,500 | Fidelity National Title | |
| Interfamily Deed Transfer | -- | North American Title Co | |
| Quit Claim Deed | -- | First American Title Ins Co |
Source: Public Records
Mortgage History
| Date | Status | Loan Amount | Loan Type |
|---|---|---|---|
| Open | $75,000 | New Conventional | |
| Open | $456,500 | New Conventional | |
| Closed | $438,021 | FHA | |
| Closed | $452,787 | FHA | |
| Previous Owner | $280,000 | New Conventional | |
| Previous Owner | $292,000 | New Conventional | |
| Previous Owner | $140,000 | Credit Line Revolving | |
| Previous Owner | $50,000 | Credit Line Revolving | |
| Previous Owner | $316,000 | Purchase Money Mortgage | |
| Previous Owner | $261,415 | FHA | |
| Previous Owner | $168,000 | No Value Available | |
| Previous Owner | $123,000 | No Value Available |
Source: Public Records
Property History
| Date | Event | Price | Change | Sq Ft Price |
|---|---|---|---|---|
| 08/15/2017 08/15/17 | Sold | $465,000 | +3.3% | $374 / Sq Ft |
| 07/12/2017 07/12/17 | For Sale | $450,000 | +21.6% | $362 / Sq Ft |
| 08/16/2013 08/16/13 | Sold | $370,000 | -1.3% | $298 / Sq Ft |
| 07/01/2013 07/01/13 | Price Changed | $375,000 | +25.4% | $302 / Sq Ft |
| 06/10/2013 06/10/13 | For Sale | $299,000 | -19.2% | $241 / Sq Ft |
| 06/07/2013 06/07/13 | Off Market | $370,000 | -- | -- |
| 06/04/2013 06/04/13 | Price Changed | $299,000 | -25.1% | $241 / Sq Ft |
| 05/27/2013 05/27/13 | For Sale | $399,000 | 0.0% | $321 / Sq Ft |
| 06/15/2012 06/15/12 | Rented | $1,900 | 0.0% | -- |
| 05/22/2012 05/22/12 | Under Contract | -- | -- | -- |
| 05/02/2012 05/02/12 | For Rent | $1,900 | -- | -- |
Source: California Regional Multiple Listing Service (CRMLS)
Tax History Compared to Growth
Tax History
| Year | Tax Paid | Tax Assessment Tax Assessment Total Assessment is a certain percentage of the fair market value that is determined by local assessors to be the total taxable value of land and additions on the property. | Land | Improvement |
|---|---|---|---|---|
| 2024 | $5,389 | $518,714 | $400,820 | $117,894 |
| 2023 | $5,261 | $508,544 | $392,961 | $115,583 |
| 2022 | $5,166 | $498,573 | $385,256 | $113,317 |
| 2021 | $5,134 | $488,798 | $377,702 | $111,096 |
| 2020 | $5,088 | $483,786 | $373,829 | $109,957 |
| 2019 | $4,986 | $474,300 | $366,499 | $107,801 |
| 2018 | $4,893 | $465,000 | $359,312 | $105,688 |
| 2017 | $4,107 | $390,809 | $278,629 | $112,180 |
| 2016 | $4,039 | $383,147 | $273,166 | $109,981 |
| 2015 | $3,990 | $377,392 | $269,063 | $108,329 |
| 2014 | $3,904 | $370,000 | $263,793 | $106,207 |
Source: Public Records
Agents Affiliated with this Home
-
Sydney Gielow
Seller's Agent in 2017
Sydney Gielow
Coldwell Banker Realty
(949) 400-1320
1 in this area
37 Total Sales
-
Tamer Batniji
Buyer's Agent in 2017
Tamer Batniji
The Listers
(949) 510-8851
2 in this area
43 Total Sales
-
Ken E. Bowen
Seller's Agent in 2013
Ken E. Bowen
RE/MAX
(949) 433-3422
3 in this area
285 Total Sales
-
Donald A. Bowen
Seller Co-Listing Agent in 2013
Donald A. Bowen
RE/MAX
(949) 290-9754
160 Total Sales
-
S
Buyer's Agent in 2013
Sue Johnson
Realty Executives
-
Mike Kashani
Buyer's Agent in 2012
Mike Kashani
PowerStone Real Estate
(949) 533-7030
1 in this area
9 Total Sales
Map
Source: California Regional Multiple Listing Service (CRMLS)
MLS Number: OC13099390
APN: 938-054-46
Disclaimer: Certain information contained herein is derived from information provided by parties other than Homes.com. All information provided is deemed reliable, but is not guaranteed to be accurate and should be independently verified.
![]() The multiple listing data appearing on this website, or contained in reports produced therefrom, is owned and copyrighted by California Regional Multiple Listing Service, Inc. ("CRMLS") and is protected by all applicable copyright laws. Information provided is for viewer's personal, non-commercial use and may not be used for any purpose other than to identify prospective properties the viewer may be interested in purchasing. All listing data, including but not limited to square footage and lot size is believed to be accurate, but the listing Agent, listing Broker and CRMLS and its affiliates do not warrant or guarantee such accuracy. The viewer should independently verify the listed data prior to making any decisions based on such information by personal inspection and/or contacting a real estate professional.
The multiple listing data appearing on this website, or contained in reports produced therefrom, is owned and copyrighted by California Regional Multiple Listing Service, Inc. ("CRMLS") and is protected by all applicable copyright laws. Information provided is for viewer's personal, non-commercial use and may not be used for any purpose other than to identify prospective properties the viewer may be interested in purchasing. All listing data, including but not limited to square footage and lot size is believed to be accurate, but the listing Agent, listing Broker and CRMLS and its affiliates do not warrant or guarantee such accuracy. The viewer should independently verify the listed data prior to making any decisions based on such information by personal inspection and/or contacting a real estate professional.
Based on information from California Regional Multiple Listing Service, Inc. and /or other sources. All data, including all measurements and calculations of area, is obtained from various sources and has not been, and will not be, verified by broker or MLS. All information should be independently reviewed and verified for accuracy. Properties may or may not be listed by the office/agent presenting the information
Nearby Homes
- 21681 Johnstone Dr
- 21702 Montbury Dr
- 22421 Rippling Brook
- 25912 Densmore Dr
- 26411 Elmcrest Way
- 22471 Rippling Brook
- 26492 Dineral
- 21981 Rimhurst Dr Unit 154
- 22192 Rim Pointe Unit 6B
- 25761 Le Parc Unit 89
- 25761 Le Parc Unit 77
- 25885 Trabuco Rd Unit 14
- 25885 Trabuco Rd Unit 305
- 25885 Trabuco Rd Unit 226
- 25885 Trabuco Rd Unit 167
- 25712 Le Parc Unit 96
- 25712 Le Parc Unit 21
- 25712 Le Parc Unit 57
- 21812 Raintree Ln
- 22272 Redwood Pointe Unit 5C