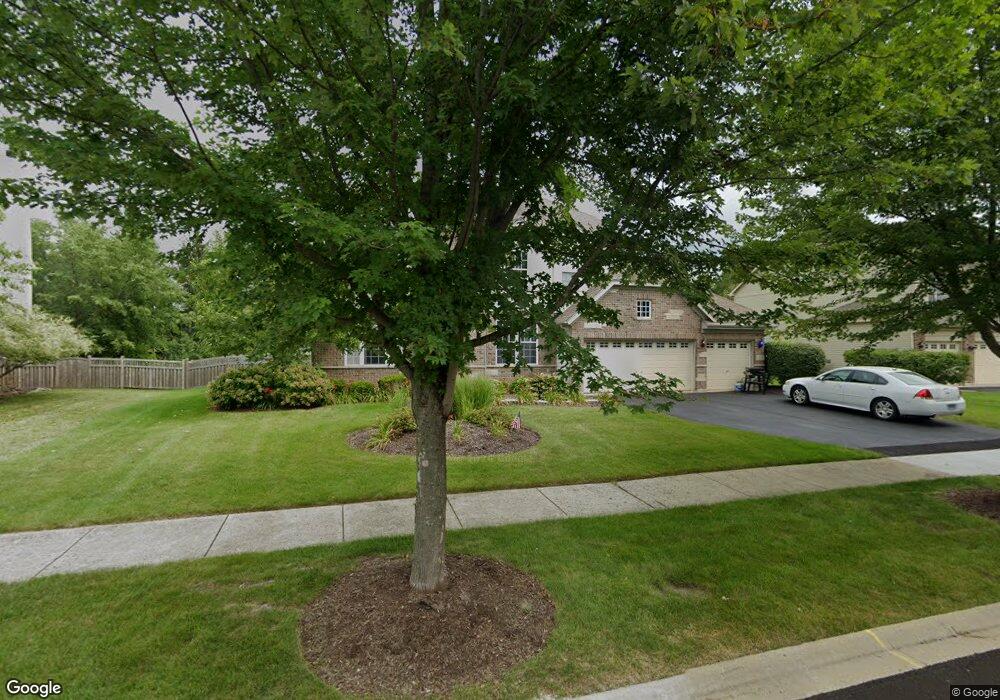
26436 Rustling Birch Way Plainfield, IL 60585
Grande Park NeighborhoodEstimated Value: $588,000 - $625,000
4
Beds
3
Baths
2,935
Sq Ft
$206/Sq Ft
Est. Value
About This Home
This home is located at 26436 Rustling Birch Way, Plainfield, IL 60585 and is currently estimated at $604,421, approximately $205 per square foot. 26436 Rustling Birch Way is a home located in Kendall County with nearby schools including Grande Park Elementary School, Murphy Junior High School, and Oswego East High School.
Ownership History
Date
Name
Owned For
Owner Type
Purchase Details
Closed on
Mar 21, 2006
Sold by
Wylie Eric G and Kowalczyk Jennifer A
Bought by
Wylie Ii Eric G
Current Estimated Value
Home Financials for this Owner
Home Financials are based on the most recent Mortgage that was taken out on this home.
Original Mortgage
$325,000
Outstanding Balance
$185,408
Interest Rate
6.33%
Mortgage Type
Fannie Mae Freddie Mac
Estimated Equity
$419,013
Purchase Details
Closed on
Oct 13, 2005
Sold by
Roycroft West Llc
Bought by
Wylie Ii Eric G and Kowalczyk Jennifer A
Home Financials for this Owner
Home Financials are based on the most recent Mortgage that was taken out on this home.
Original Mortgage
$300,000
Interest Rate
5.8%
Mortgage Type
Fannie Mae Freddie Mac
Purchase Details
Closed on
Apr 5, 2005
Sold by
Mpi-1 Development Llc
Bought by
Roycroft West Llc
Create a Home Valuation Report for This Property
The Home Valuation Report is an in-depth analysis detailing your home's value as well as a comparison with similar homes in the area
Home Values in the Area
Average Home Value in this Area
Purchase History
| Date | Buyer | Sale Price | Title Company |
|---|---|---|---|
| Wylie Ii Eric G | -- | Netco | |
| Wylie Ii Eric G | $454,000 | Chicago Title Insurance Co | |
| Roycroft West Llc | $770,000 | Chicago Title Insurance Co |
Source: Public Records
Mortgage History
| Date | Status | Borrower | Loan Amount |
|---|---|---|---|
| Open | Wylie Ii Eric G | $325,000 | |
| Closed | Wylie Ii Eric G | $300,000 | |
| Closed | Roycroft West Llc | $0 | |
| Closed | Roycroft West Llc | $77,000 |
Source: Public Records
Tax History
| Year | Tax Paid | Tax Assessment Tax Assessment Total Assessment is a certain percentage of the fair market value that is determined by local assessors to be the total taxable value of land and additions on the property. | Land | Improvement |
|---|---|---|---|---|
| 2024 | $13,409 | $166,427 | $30,170 | $136,257 |
| 2023 | $11,740 | $144,719 | $26,235 | $118,484 |
| 2022 | $11,740 | $131,563 | $23,850 | $107,713 |
| 2021 | $11,540 | $125,298 | $22,714 | $102,584 |
| 2020 | $11,067 | $119,331 | $21,632 | $97,699 |
| 2019 | $10,355 | $110,449 | $21,632 | $88,817 |
| 2018 | $10,171 | $107,966 | $21,146 | $86,820 |
| 2017 | $9,830 | $99,051 | $19,400 | $79,651 |
| 2016 | $10,372 | $102,805 | $27,471 | $75,334 |
| 2015 | $10,525 | $99,811 | $26,671 | $73,140 |
| 2014 | -- | $95,058 | $25,401 | $69,657 |
| 2013 | -- | $92,289 | $24,661 | $67,628 |
Source: Public Records
Map
Nearby Homes
- 26414 Rustling Birch Way
- 26105 Grande Park Blvd
- 26101 Grande Park Blvd
- 26244 W Sablewood Cir
- 26232 W Sablewood Cir
- 26257 W Sablewood Cir
- 26228 W Sablewood Cir
- 26241 W Sablewood Cir
- 26261 W Sablewood Cir
- 26305 W Sablewood Cir
- 26341 W Sablewood Cir
- 26313 W Sablewood Cir
- 26216 W Sablewood Cir
- 26308 W Sablewood Cir
- 26212 W Sablewood Cir
- 13504 S Coronado Cir
- 26312 W Sablewood Cir
- 13510 S Coronado Cir
- 13516 S Coronado Cir
- 26105 W Grande Park Blvd
- 26424 Rustling Birch Way
- 26437 Rustling Birch Way
- 26504 Rustling Birch Way
- 26501 Rustling Birch Way
- 26429 Rustling Birch Way
- 26507 Rustling Birch Way
- 26418 Rustling Birch Way
- 26425 Rustling Birch Way
- 26508 Rustling Birch Way
- 13410 Morning Mist Place
- 13406 Morning Mist Place
- 26419 Rustling Birch Way
- 13402 Morning Mist Place
- 13414 Morning Mist Place
- 26513 Rustling Birch Way
- 26512 Rustling Birch Way
- 26415 Rustling Birch Way
- 13344 Morning Mist Place
- 13418 Morning Mist Place
- 13340 Morning Mist Place
Your Personal Tour Guide
Ask me questions while you tour the home.