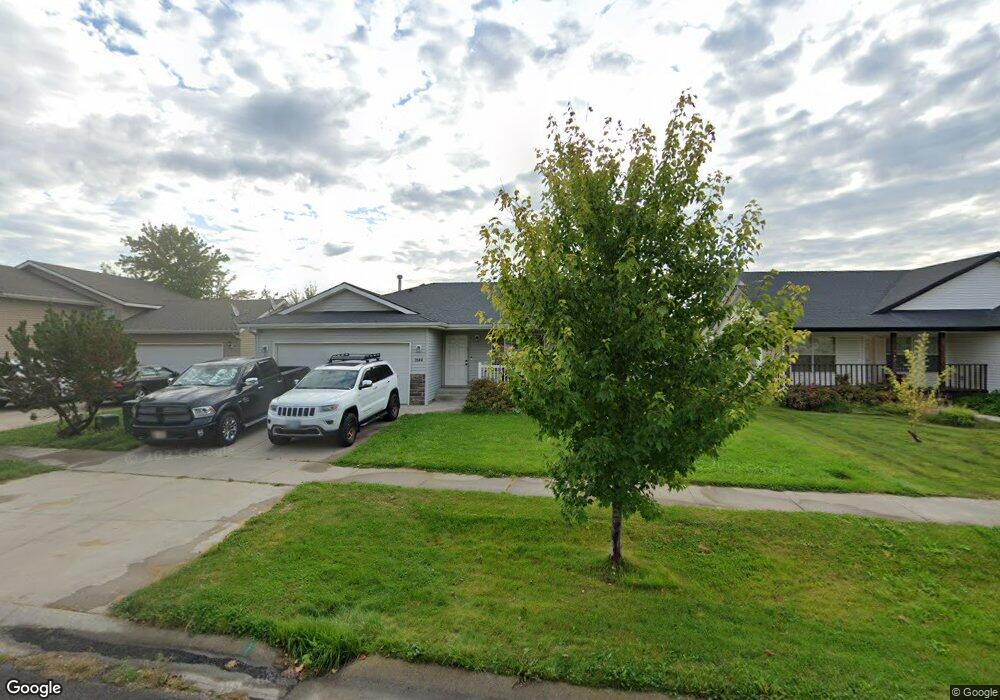
2644 N Sparrow Loop Post Falls, ID 83854
North Prairie NeighborhoodEstimated Value: $410,000 - $448,000
3
Beds
2
Baths
1,202
Sq Ft
$357/Sq Ft
Est. Value
About This Home
This home is located at 2644 N Sparrow Loop, Post Falls, ID 83854 and is currently estimated at $428,925, approximately $356 per square foot. 2644 N Sparrow Loop is a home located in Kootenai County with nearby schools including Prairie View Elementary School, Post Falls Middle School, and Post Falls High School.
Ownership History
Date
Name
Owned For
Owner Type
Purchase Details
Closed on
Mar 23, 2015
Sold by
Riggs Gregory E
Bought by
Bluehaven Enterprises Llc
Current Estimated Value
Purchase Details
Closed on
Oct 12, 2012
Sold by
Investor Holdings Llc
Bought by
Riggs Gregory E
Home Financials for this Owner
Home Financials are based on the most recent Mortgage that was taken out on this home.
Original Mortgage
$144,620
Interest Rate
3.58%
Mortgage Type
VA
Purchase Details
Closed on
Jul 24, 2007
Sold by
Gunter Trevor A
Bought by
Hanson Christopher M and Hanson Kelly K
Home Financials for this Owner
Home Financials are based on the most recent Mortgage that was taken out on this home.
Original Mortgage
$171,768
Interest Rate
6.73%
Mortgage Type
New Conventional
Purchase Details
Closed on
Jan 30, 2006
Sold by
Hallmark Homes Inc
Bought by
Gunter Trevor A
Home Financials for this Owner
Home Financials are based on the most recent Mortgage that was taken out on this home.
Original Mortgage
$160,160
Interest Rate
6.15%
Mortgage Type
New Conventional
Create a Home Valuation Report for This Property
The Home Valuation Report is an in-depth analysis detailing your home's value as well as a comparison with similar homes in the area
Home Values in the Area
Average Home Value in this Area
Purchase History
| Date | Buyer | Sale Price | Title Company |
|---|---|---|---|
| Bluehaven Enterprises Llc | -- | Req Of First American Title | |
| Riggs Gregory E | -- | Alliance Title | |
| Hanson Christopher M | -- | -- | |
| Gunter Trevor A | -- | -- |
Source: Public Records
Mortgage History
| Date | Status | Borrower | Loan Amount |
|---|---|---|---|
| Previous Owner | Riggs Gregory E | $144,620 | |
| Previous Owner | Hanson Christopher M | $171,768 | |
| Previous Owner | Gunter Trevor A | $160,160 |
Source: Public Records
Tax History
| Year | Tax Paid | Tax Assessment Tax Assessment Total Assessment is a certain percentage of the fair market value that is determined by local assessors to be the total taxable value of land and additions on the property. | Land | Improvement |
|---|---|---|---|---|
| 2025 | $2,363 | $391,080 | $175,000 | $216,080 |
| 2024 | $2,429 | $385,640 | $152,000 | $233,640 |
| 2023 | $2,429 | $412,331 | $160,000 | $252,331 |
| 2022 | $2,698 | $437,868 | $157,500 | $280,368 |
| 2021 | $2,811 | $278,340 | $105,000 | $173,340 |
| 2020 | $2,776 | $243,430 | $90,000 | $153,430 |
| 2019 | $2,773 | $219,540 | $90,000 | $129,540 |
| 2018 | $2,622 | $188,140 | $70,000 | $118,140 |
| 2017 | $2,515 | $165,260 | $50,000 | $115,260 |
| 2016 | $2,401 | $149,120 | $40,000 | $109,120 |
| 2015 | $1,229 | $144,060 | $37,000 | $107,060 |
| 2013 | $635 | $122,060 | $32,000 | $90,060 |
Source: Public Records
Map
Nearby Homes
- 2444 N Sparrow Loop
- 4350 E Bogie Dr
- 4184 E Bogie Dr
- 4226 E Bogie Dr
- 4398 E Bogie Dr
- 4314 E Bogie Dr
- 4264 E Bogie Dr
- 4440 E Bogie Dr
- 2593 E Natti Ct
- 3648 White Sands Ln
- 2826 N Charlene Kelsy St
- 2613 E Cinder Ave
- 2707 N Neptune St
- 2651 E Cinder Ave
- 2725 N Neptune St
- 2902 N Charlene Kelsy St
- 2660 N Neptune St
- 2728 N Neptune St
- 2824 N Neptune St
- 2925 N Neptune St
- 2644 Sparrow Loop
- 2654 Sparrow Loop
- 2636 N Sparrow Loop
- 2654 N Sparrow Loop
- 2662 Sparrow Loop
- 2662 N Sparrow Loop
- 2624 N Sparrow Loop
- 2645 N Sparrow Loop
- 2655 N Sparrow Loop
- 2635 N Sparrow Loop
- 2672 Sparrow Loop
- 2672 N Sparrow Loop
- 2610 Sparrow Loop
- 2610 N Sparrow Loop
- 2550 N Greensferry Rd
- 2667 N Sparrow Loop
- 2625 N Sparrow Loop
- 2626 N Greensferry Rd
- 2625 Sparrow Loop
- 2041 E Knapp Dr
Your Personal Tour Guide
Ask me questions while you tour the home.