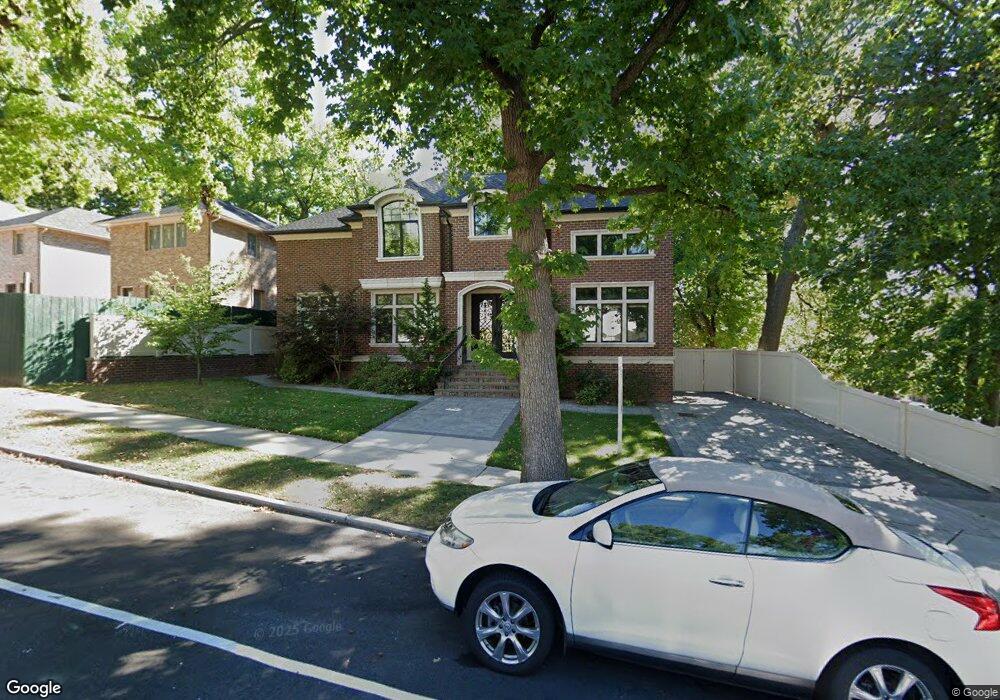
26446 73rd Ave Unit 2nd Fl Glen Oaks, NY 11004
Glen Oaks NeighborhoodEstimated Value: $1,658,000 - $2,082,000
4
Beds
2
Baths
3,754
Sq Ft
$509/Sq Ft
Est. Value
About This Home
This home is located at 26446 73rd Ave Unit 2nd Fl, Glen Oaks, NY 11004 and is currently estimated at $1,910,368, approximately $508 per square foot. 26446 73rd Ave Unit 2nd Fl is a home located in Queens County with nearby schools including P.S. 186 Castlewood, Fremont/Hay Elementary School, and Irwin Altman Middle School 172.
Ownership History
Date
Name
Owned For
Owner Type
Purchase Details
Closed on
Nov 1, 2024
Sold by
Lce Home Llc
Bought by
Lee Zhi Peng
Current Estimated Value
Home Financials for this Owner
Home Financials are based on the most recent Mortgage that was taken out on this home.
Original Mortgage
$700,000
Outstanding Balance
$691,905
Interest Rate
6.32%
Mortgage Type
Purchase Money Mortgage
Estimated Equity
$1,218,463
Purchase Details
Closed on
Sep 20, 2022
Sold by
Dorrian Thomas
Bought by
Lce Home Llc
Purchase Details
Closed on
Aug 23, 2013
Sold by
Nsj Ashe Llc
Bought by
Dorrian Thomas
Home Financials for this Owner
Home Financials are based on the most recent Mortgage that was taken out on this home.
Original Mortgage
$417,000
Interest Rate
4.53%
Mortgage Type
New Conventional
Purchase Details
Closed on
May 6, 2013
Sold by
Wimpfheimer Ruth L and Wimpfheimer Steven
Bought by
Nsj Ashe Llc
Create a Home Valuation Report for This Property
The Home Valuation Report is an in-depth analysis detailing your home's value as well as a comparison with similar homes in the area
Home Values in the Area
Average Home Value in this Area
Purchase History
| Date | Buyer | Sale Price | Title Company |
|---|---|---|---|
| Lee Zhi Peng | $1,850,000 | -- | |
| Lee Zhi Peng | $1,850,000 | -- | |
| Lce Home Llc | $2,090,000 | -- | |
| Lce Home Llc | $2,090,000 | -- | |
| Dorrian Thomas | $684,000 | -- | |
| Dorrian Thomas | $684,000 | -- | |
| Nsj Ashe Llc | $658,000 | -- | |
| Nsj Ashe Llc | $658,000 | -- |
Source: Public Records
Mortgage History
| Date | Status | Borrower | Loan Amount |
|---|---|---|---|
| Open | Lee Zhi Peng | $700,000 | |
| Closed | Lee Zhi Peng | $700,000 | |
| Previous Owner | Dorrian Thomas | $417,000 |
Source: Public Records
Tax History Compared to Growth
Tax History
| Year | Tax Paid | Tax Assessment Tax Assessment Total Assessment is a certain percentage of the fair market value that is determined by local assessors to be the total taxable value of land and additions on the property. | Land | Improvement |
|---|---|---|---|---|
| 2025 | $19,765 | $104,309 | $19,931 | $84,378 |
| 2024 | $19,765 | $98,405 | $20,101 | $78,304 |
| 2023 | $19,222 | $95,705 | $16,502 | $79,203 |
| 2022 | $18,024 | $106,740 | $21,840 | $84,900 |
| 2021 | $18,772 | $107,040 | $21,840 | $85,200 |
| 2020 | $18,399 | $105,060 | $21,840 | $83,220 |
| 2019 | $17,154 | $102,780 | $21,840 | $80,940 |
| 2018 | $16,258 | $79,754 | $20,301 | $59,453 |
| 2017 | $15,338 | $75,240 | $21,840 | $53,400 |
| 2016 | $13,971 | $75,240 | $21,840 | $53,400 |
| 2015 | $4,121 | $21,840 | $21,840 | $0 |
| 2014 | $4,121 | $33,900 | $21,840 | $12,060 |
Source: Public Records
Map
Nearby Homes
- 264-37 Langston Ave Unit A
- 264-15 Langston Ave Unit 1st FL
- 264-11 73rd Ave Unit 128A4
- 264-17 Langston Ave Unit 2nd fl
- 264-65 Langston Ave Unit GV133E10-2
- 27010 Grand Central Pkwy Unit 19A
- 27010 Grand Central Pkwy Unit 27F
- 27010 Grand Central Pkwy Unit 8H
- 27010 Grand Central Pkwy Unit 22S
- 27010 Grand Central Pkwy Unit 33G
- 27010 Grand Central Pkwy Unit 32M
- 27010 Grand Central Pkwy Unit 4U
- 270-10 Grand Central Pkwy Unit 33-O
- 27010 Grand Central Pkwy Unit 21M
- 27010 Grand Central Pkwy Unit 25O
- 27010 Grand Central Pkwy Unit 12O
- 27010 Grand Central Pkwy Unit 32B
- 270-10 Grand Central Pkwy Unit 2-L
- 27010 Grand Central Pkwy Unit 16S
- 27010 Grand Central Pkwy Unit 17K
- 26446 73rd Ave
- 26446 73rd Ave Unit 1st Fl
- 26446 73rd Ave
- 26446 73rd Ave
- 264-52 73rd Ave Unit 2F
- 264-52 73rd Ave Unit 1F
- 264-52 73rd Ave
- 26452 73rd Ave
- 26452 73rd Ave
- 26452 73rd Ave
- 26456 73rd Ave
- 26460 73rd Ave
- 26456 73rd Ave
- 264-60 73rd Ave Unit 1
- 264-60 73rd Ave
- 26422 73rd Ave Unit 1+Bsmt
- 7222 267th St
- 26451 73rd Ave
- 26445 73rd Ave
- 26431 Langston Ave Unit 1st fl